


INTRODUCTION
Obstructive sleep apnea (OSA), a common clinical disorder, is characterized by recurrent upper airway collapse and obstruction. Twenty-four percent of men and 9% of women experience at least five events of disordered breathing per hour of sleep [1]. The diagnosis and severity of OSA is typically reflected by the apnea-hypopnea index (AHI), which is a measure of the total number of total or partial upper airway obstructions lasting >10 seconds, divided by the sum of sleep time.
In clinical studies, OSA severity frequently changes over the course of a night according to the sleep stage. It has also been widely accepted that rapid eye movement (REM)-AHI may be higher than non-rapid eye movement (NREM)-AHI in OSA patients [2-7], and OSA would be more severe during light sleep compared with deep sleep stage.
However, there are some discrepancies in the AHI according to the sleep stage. Some studies have reported that the severity of OSA is higher during slow wave sleep (SWS) or NREM sleep compare to light sleep or REM sleep in patients with severe OSA [8-10]. But the studies published so far did not indicate proportions of the small group of patients and did not consider positional effect.
Therefore, the present study aimed to investigate the AHI according to the sleep stage (i.e., REM, NREM stage N1 and N2, and SWS) in more detail after control of posture, as well as to explore clinical variables affecting differences in the AHI according to the sleep stage if possible.
MATERIALS AND METHODS
Study population
The clinical and polysomnographic features of patients who underwent nocturnal polysomnography at the Asan Medical Center (Seoul, Korea) between December 2007 and July 2018 were retrospectively reviewed. Inclusion criteria were as follows: age at diagnosis >18 years, AHI >5 events/hr in polysomnography, and patients who underwent polysomnography in the supine position (100% of the time) were included to control for posture. Patients with sleep efficacy Ōēż80% and SWS Ōēż1 minute were excluded. Finally, 234 patients were included in this study. This study was approved by the Institutional Review Board of Asan Medical Center (IRB No. 2018-1095). Informed consent was waived as this is a retrospective study.
Subgroup analysis
A commonly used diagnostic criterion is based on the ratio of AHI during REM sleep to the AHI during NREM sleep (AHIREM/AHINREM), with a value of at least two indicating a predominance of disordered breathing during REM sleep. Following this criterion, the patients were divided into one of the three groups to compare clinical and polysomnographic features: REM-dominant (AHIREM/AHINREM >2), NREM-dominant (AHINREM/AHIREM >2), and non-dominant groups. AHIN1N2 (AHI of N1 and N2 sleep stage) was also calculated for the evaluation of light sleep stage. The equation for AHIN1N2 is as follows:
AHIN1N2=(AHIN1├ŚTimeN1+AHIN2├ŚTimeN2)/(TimeN1+TimeN2)
Patients were also divided into one of the two groups: light sleep group (with higher AHIN1N2 than AHISWS) and SWS group (with higher AHISWS than AHIN1N2). All patients were evaluated for the body mass index (BMI), age, sex, AHI, respiratory disturbance index (RDI), AHINREM, AHIN1, AHIN2, AHISWS, and AHIREM.
Statistical analysis
All continuous quantitative variables are presented as mean and standard deviation, and normal distribution of variables was assessed using the Kolmogorov-Smirnov test. Comparisons between and among the REM-dominant, non-dominant, and NREM-dominant groups were performed using one-way analysis of variance (ANOVA). Categorical variables were assessed using Fisher exact test. For observations of the AHI according to the sleep stage (REM, NREM stage N1 and N2, SWS), statistical analysis was performed using repeated measures ANOVA and multiple comparison by Bonferroni correction. Comparisons between the light sleep and SWS group were performed using independent sample t-tests and the Mann-Whitney U-tests for normally and non-normally distributed data, respectively. All analyses were performed using SPSS ver. 18.0 (SPSS Inc., Chicago, IL, USA). A P<0.05 was considered to be statistically significant.
RESULTS
Clinical and polysomnographic characteristics of patients
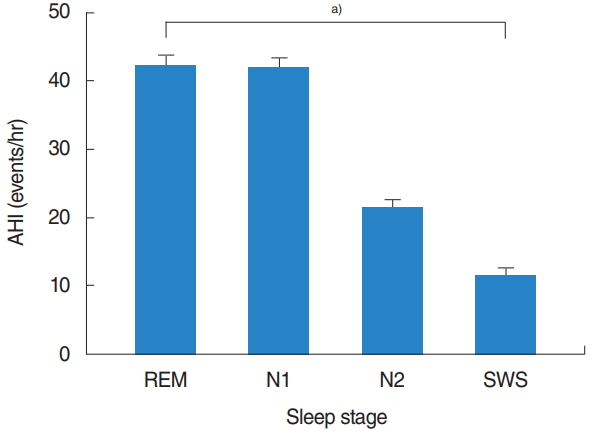
A total of 234 eligible patients (197 [84.2%] men and 37 [15.8%] women), with a median age of 47.4┬▒13.9 years were evaluated. Baseline demographics and polysomnographic data are summarized in Table 1. The mean total sleep time was 359.1┬▒129.3 minutes, with an REM sleep time of 55.8┬▒29.4 minutes and NREM sleep time of 267.9┬▒78.2 minutes. The mean AHI was 26.9┬▒19.1 events/hr and mean RDI was 30.3┬▒19.4 events/hr. In the entire sample, the mean AHIREM was higher than the mean AHINREM (39.9┬▒23.2 events/hr vs. 24.5┬▒20.5 events/hr). Among the NREM sleep stage, the mean AHI tended to decrease with N1 (39.4┬▒25.1 events/hr), N2 (20.0┬▒18.7 events/hr), and SWS (10.6┬▒18.2 events/hr) stage. Among all patients, there were statistically significant differences (overall P<0.001) in the AHI according to each sleep stage: AHIREM was higher than AHIN1 (P=1.000), AHIN1 was higher than AHIN2 (P<0.001), and AHIN2 was higher than AHISWS (P=0.001) (Fig. 1).
Comparison of REM-dominant, NREM-dominant, and non-dominant groups
There were 108 patients (46.2%) in the REM-dominant group, 88 (37.6%) in the non-dominant group, and 38 (16.2%) in the NREM-dominant group. Table 2 presents a comparison of the clinical and polysomnographic features of the three groups. The mean AHI was significantly higher in the NREM-dominant group than in the REM-dominant group (32.9┬▒22.9 events/hr vs 18.3┬▒9.5 events/hr, respectively; P<0.001). Among the NREM sleep stage, the AHI and RDI of N1, N2, and SWS were also significantly higher in the NREM-dominant group than in the REM-dominant group (P<0.001, respectively). The AHI and RDI of the REM sleep stage were significantly higher in the REM-dominant group than in the NREM-dominant group (P=0.002 and P<0.001, respectively). In the present study, no significant differences were observed among the three groups in age, BMI, or sex (P>0.05 for all).
Comparison of light sleep and deep sleep groups
To analyze light sleep stage (N1 and N2) and deep sleep stage (SWS), AHIN1N2 was compared with AHISWS. Almost all patients had higher AHIN1N2 than AHISWS; however, 16 of 234 (6.8%) patients exhibited a higher AHISWS than AHIN1N2. The clinical and polysomnographic characteristics of the two groups are summarized in Table 3. The data showed a higher AHI and RDI in the SWS group than in the light sleep group, even during SWS periods; the AHI of the SWS group was approximately seven times higher than that of the light sleep group. Significant differences were observed in AHI and RDI in NREM sleep stage, especially in N2 and SWS between the two groups. This results indicated that severe OSA patients exhibited more severe AHISWS compared with mild to moderate OSA patients.
DISCUSSION
The activity of the respiratory muscles and upper airway occlusion varies according to sleep stage [3,11]. Among the various sleep stages, individuals are most vulnerable to disordered breathingŌĆöwith a greater length of apneas, hypoxemia, and hypercapniaŌĆöin REM sleep than in any other sleep stage [5]. The tone of the upper airway, including the genioglossus, decreases from wakefulness to NREM sleep and is the lowest in REM sleep, predisposing to airway collapse [4,12]. Furthermore, medullary chemosensitivity to hypoxia and hypercapnia exhibit similar trends in the reduction of respiratory response during REM sleep [13,14]. Therefore, many OSA patients experience more respiratory events in REM sleep with the highest degree of oxygen desaturation [6]. The present findings demonstrated similar tendencies in that apnea occurred more often during the REM sleep stage in the total study population (Table 1).
In the NREM sleep stages, frequent arousal and apnea threshold according to sleep stage may contribute breathing instability. When arousal does occur, it enhances the hyperventilation following termination of the respiratory event and thus the arousal can yield hypocapnia below apnea threshold and further airway obstruction on return to sleep [15]. Among the NREM sleep stages, OSA improves during SWS. Ratnavadivel et al. [16] demonstrated an improvement in the AHI and arousal index from stage 1 to 4 NREM sleep (P<0.001). This may be related to sleep stage-specific influences on dynamic upper airway control. It is well known that SWS is associated with increased upper airway dilator muscle activity [17]. Moreover, a relatively higher respiratory arousal threshold during SWS has been identified as a breathing stabilizing factor, affecting the improvement in apnea during SWS [18,19]. If the respiratory drive is elevated, breathing becomes unstable, leading to upper airway obstruction. In contrast, if the respiratory drive is low, as during SWS, breathing becomes stable. Our results also demonstrated the lowest AHI during SWS, followed by N1 and N2 sleep, and REM sleep, in that order.
The present study, however, yielded some novel findings after subgroup analysis. First, there were 38 (16.2%) NREM-dominant patients who exhibited an AHINREMAHINREM that was two times higher than AHIREM (Table 2). In this study, we defined an NREM-dominant patient as similar to a REM-dominant individual; the subgroup analysis showed that the severity of the AHI in the NREM-dominant group was higher than that of the REM-dominant group. Although several other studies have reported results similar to ours [8-10], our findings are more meaningful because they are a simple comparison of the AHI in REM sleep and NREM sleep without any specific definition and control of posture. In future studies involving a larger sample size, it would be ideal to investigate the characteristics of these NREM-dominant patients if more can be recruited.
Second, several studies have recently compared the AHI according to the NREM sleep stage, and there have been reports that the AHI improved in SWS. In the present study, similar results were obtained in general, but there were an unexpected 16 patients (6.8%) whose AHISWS was higher than AHIN1N2. As shown in Table 3, there was some trend toward higher AHI in those patients, suggesting that OSA was more severe in patients in whom AHISWS was higher than AHIN1N2.
One possible explanation for these unusual findings is the impairment of a compensatory mechanism(s). Healthy and OSA patients with intact neuromuscular compensatory mechanisms appear to compensate for an anatomically compromised upper airway through protective reflexes that increase upper airway dilator muscle activity to maintain airway patency during sleep [20]. For instance, the tone of the upper airway muscles, including the genioglossus, decreases from wakefulness to NREM sleep and is the lowest in REM sleep [4,12], and SWS is associated with increased upper airway dilator muscle activity that contributes to the improvement in apnea severity [17]. However, patients with severe OSA may have a sensory impairment of upper airway structures, which make them unable to respond to negative pharyngeal pressure due to repeated mechanical trauma and/or hypoxemia [21]. Therefore, in these patients, the compensatory mechanism mentioned above does not function properly; therefore, the AHI may become more severe in NREM and SWS. Further studies are needed to clarify the pathophysiology and explain these unusual findings.
The subgroup analysis, which represents one of the strengths of our study, revealed heterogenetic features of OSA. Considering this point, when we titrate the optimal pressure of continuous positive airway pressure, we may need to consider not only supine REM sleep, which is common, but also other sleep stages that have the highest AHI values. Another strength of our study is that we enrolled patients who underwent polysomnography in the supine position (100% of the time) at total sleep stage to control for posture because the collapsibility of the upper airway and the severity of OSA is strongly influenced by the body position [22,23].
However, there are some limitations in this present study. The first is that the study sample was evaluated retrospectively. Second, we had not considered factors that might have influence on the sleep position. Severity of OSA and other factors may have influence on the sleep position. Further studies are needed to clarity the factors affecting the sleep position. Third, there is a selection bias because we choose the patients who underwent polysomnography only in the supine position (100% of the time). If we did not select the patients in supine position 100%, we should analyze subgroup in each sleep position and each sleep stage to adjust positional effect. Then the number of subgroup would be much larger and analysis would be too complicated. Therefore, we decided to control of posture to see more clearly the difference of AHI according to sleep stage.
Various factors, such as the BMI, sex, age, body position, and medication, are known to contribute to the development of OSA, and it can be presumed that these factors affect the quality and quantity of sleep by different mechanisms in each sleep stage. There are many treatment options for OSA, including weight loss, positional therapy, surgery, and positive airway pressure devices. The effect of treatment options on sleep apnea may differ within the sleep stage; moreover, suitable treatment options for each type of sleep-disordered breathing remains unclear. Further studies are needed to determine the significance of different sleep stages, and we need to take a different approach to each type of sleep-disordered breathing because each sleep stage may contribute to a different pathophysiology of OSA.