


INTRODUCTION
Minimally invasive imaging techniques, such as computed tomography (CT), magnetic resonance imaging (MRI), positron emission tomography, and ultrasound scan, have revolutionized diagnostics during the past decades. Some of these techniques enable three-dimensional (3D) visualization; however, their axial resolution is typically limited to a few millimeters in standard clinical applications [1,2]. Although these imaging techniques are useful diagnostic modalities, they have some limitations such as insufficient resolution for visualizing the details of ear microstructures and pathologies, radiation exposure in CT, and high cost in MRI [3]. Optical coherence tomography (OCT), which is a relatively new medical diagnostic imaging modality in otologic fields, provides noninvasive two-dimensional (2D) and 3D cross-sectional images of internal structures with a spatial resolution of 1 to 15 µm, higher than that of CT and MRI [4]. In addition, it can be operated safely, in vivo, and provide real time imaging with low cost.
Application of OCT to otologic field has become mainstream research over the past decades. People have used OCT to look at not only the morphological information of the middle and inner ear, but also their dynamic vibrations, and explored clinical applications of the OCT for diagnosis of middle ear diseases [5-9]. For practical clinical adjustment, it is important to be able to observe the middle and inner ear by transmitting the tympanic membrane (TM) from the outside the TM using OCT. Although several studies have revealed OCT to show middle and inner ear structures, researches about the anatomical accuracy of OCT is still lacking [10].
Therefore, in the present study, we presented in vivo images about the middle and inner ear taken outside TM in rats and mice to illustrate the feasibility of using OCT to image various microstructures involving the ossicular chain and cochlea, and compared the structures observed in histologic findings and OCT images to reveal the reliability and accuracy of OCT.
MATERIALS AND METHODS
OCT system and instrumentation
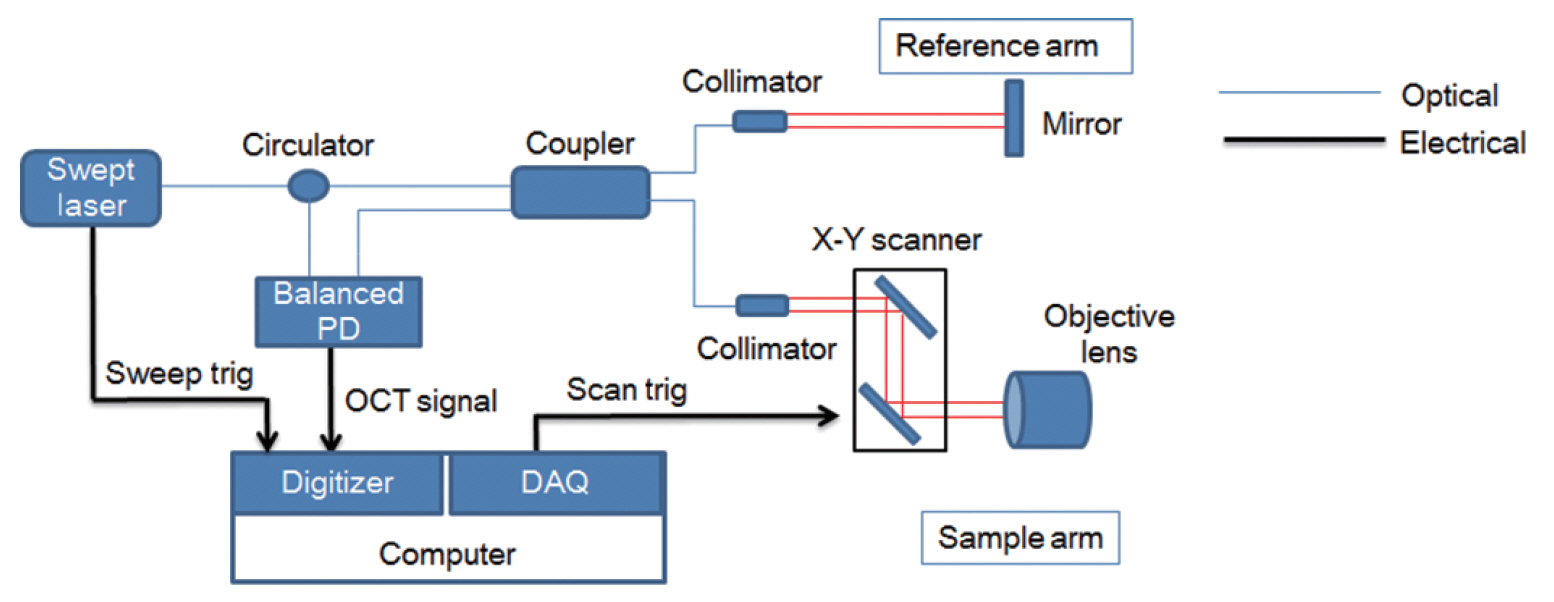
Fig. 1 shows a schematic of the experimental setup using the OCT system (KY-OCT-100; Koh Young Technology, Seoul, Korea), which was equipped with a swept-source light source with a central wavelength of 1,310 nm, a spectral bandwidth of 105 nm, and average output power of 6 mW. The axial scan rate was 100 kHz, axial resolution was 7 µm, lateral resolution was 13 µm, and signal to noise ratio was 100 dB. Two-dimensional images were obtained at a 4 mm×4 mm (600×800 pixels) size in real-time, and 3D images were also reconstructed based on the 2D images in a 4 mm×4 mm×4 mm (600×800×800 pixels) size. The light coming from the light source divides at the coupler: one goes to the reference mirror and the other goes to the tissue sample. The two reflected beams combine and interfered at a coupler. The photodiode detector (PDB 470C; Thorlabs, Newton, NJ, USA) converts the light into an analogue electrical signal, which is then digitized, and Fourier transformed into cross-section images. The synchronization of triggered signals from the light source and the output signals of a data acquisition board (NI PXI-6115; National Instruments, Austin, TX, USA) enabled the production of 2D and 3D images.
Animal preparation
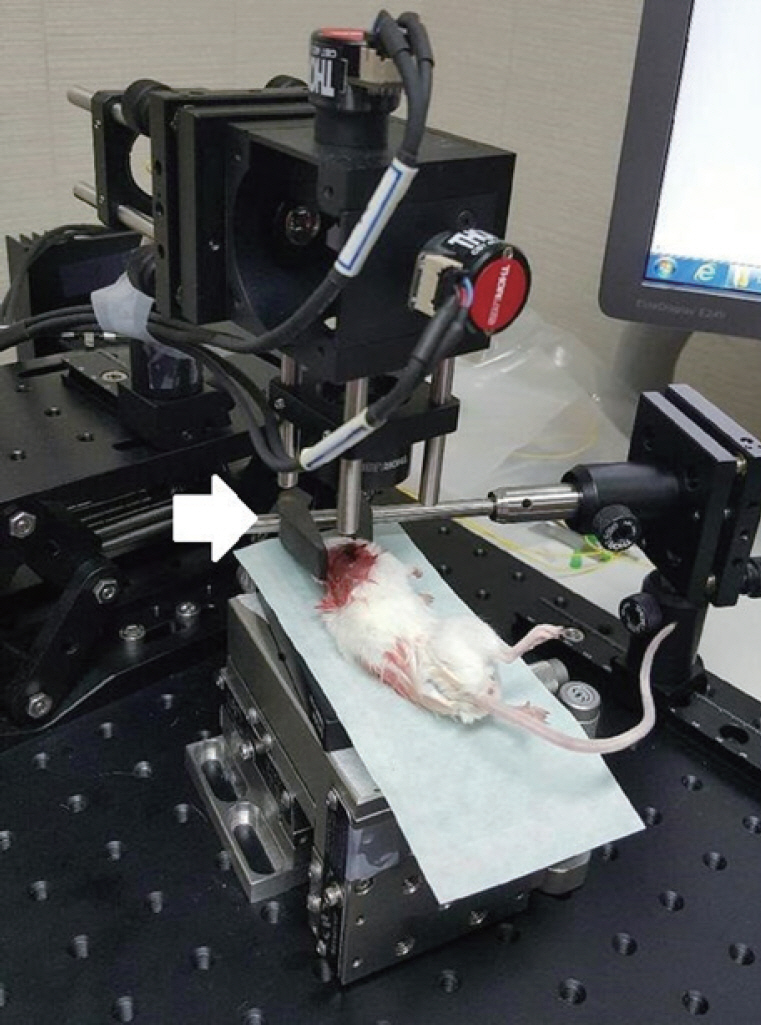
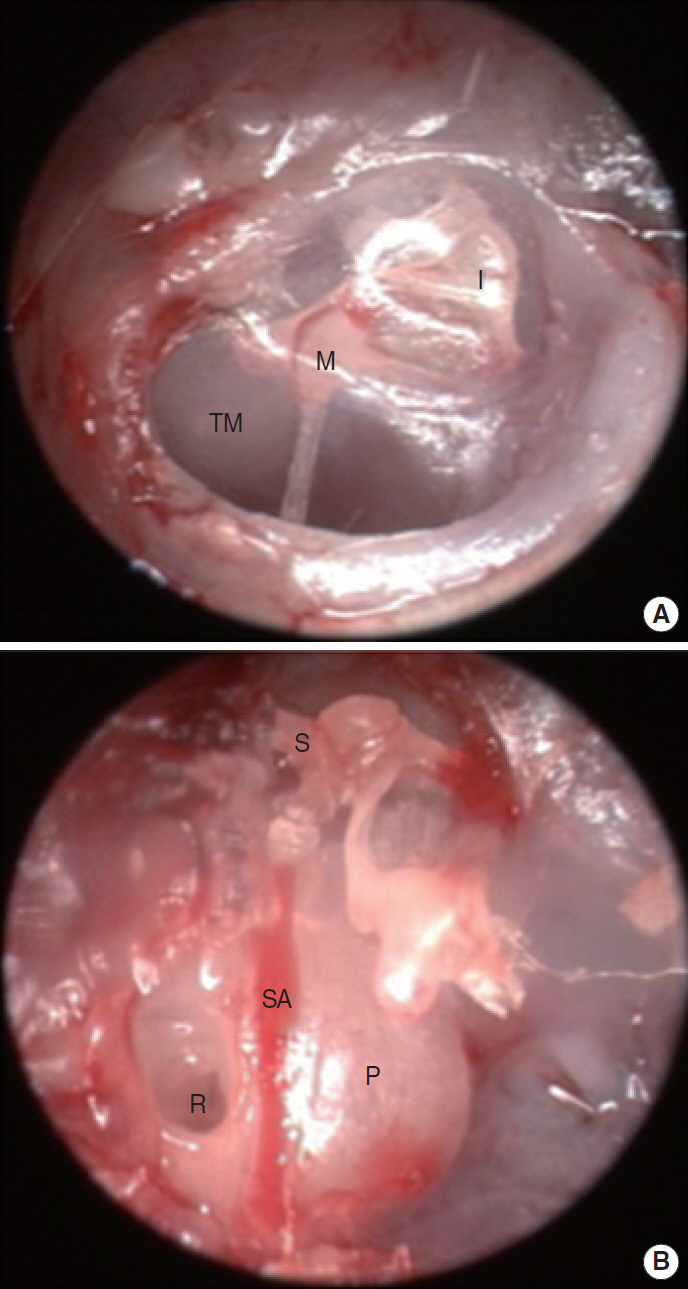
The surgical procedure for rats and mice were conducted in accordance with the guidelines of the Institutional Animal Care and Use Committee of Pusan National University (No. PNUH-2016-075). A total of five live male BALB/c mice (24–28 days old, 15–30 g) and five live male Sprague-Dawley rats (10–12 weeks old, 240–260 g) were used. Animal preparation procedures were similar for mice and rats although detailed structures were different. Before surgery, the mice and rats were anesthetized with a mixture of 30 mg/kg Zoletil (Virbac, Carros, France) and xylazine hydrochloride (0.7 mg/100 g). Following local injection of 2% lidocaine HCL and epinephrine (1:200,000) around the auricle, the auricle and cartilaginous external auditory canal were removed to expose the whole TM. A holder that could fix the head was invented in order to get a clear visualization of the structures, because the fine movement due to breathing could blur the OCT images (Fig. 2). Two-dimensional images were confirmed on the screen where the middle ear structures were well observed, and the 3D image was successively obtained using the program, which took about 20 to 30 seconds. After obtaining the images taken outside the TM, in order to obtain images that were not observed from outside the TM, the TM was gently removed with the ossicles intact, and the bony rim of the external auditory canal and bulla were drilled until the entire cochlea was visible by OCT (Fig. 3).
Histologic assessment
After obtaining the OCT imaging, mice and rats were sacrificed with carbon dioxide. And the temporal bones were directly excised, and removed the tympanic bulla bone. Then exposed cochlea was perilymphatically perfused with 4% paraformaldehyde, and immersed in 4% PFA at 4°C for overnight. Next, the specimens were decalcified with 10% ethylenediaminetetraacetic acid (17385-0401; Junsei, Tokyo, Japan) for 10 days. The samples were embedded, frozen, and thereafter midmodiolar cryosectioned in a thickness of 8 µm using Cryocut microstome (CM1510S; Leica, Wetzlar, Germany). The cryosections were then stained with hematoxylin and eosin (H&E; Sigma Aldrich, St. Louis, MO, USA) and viewed with an optical microscope (Eclipse 80i; Nikon, Shinagawa, Japan).
RESULTS
Mouse
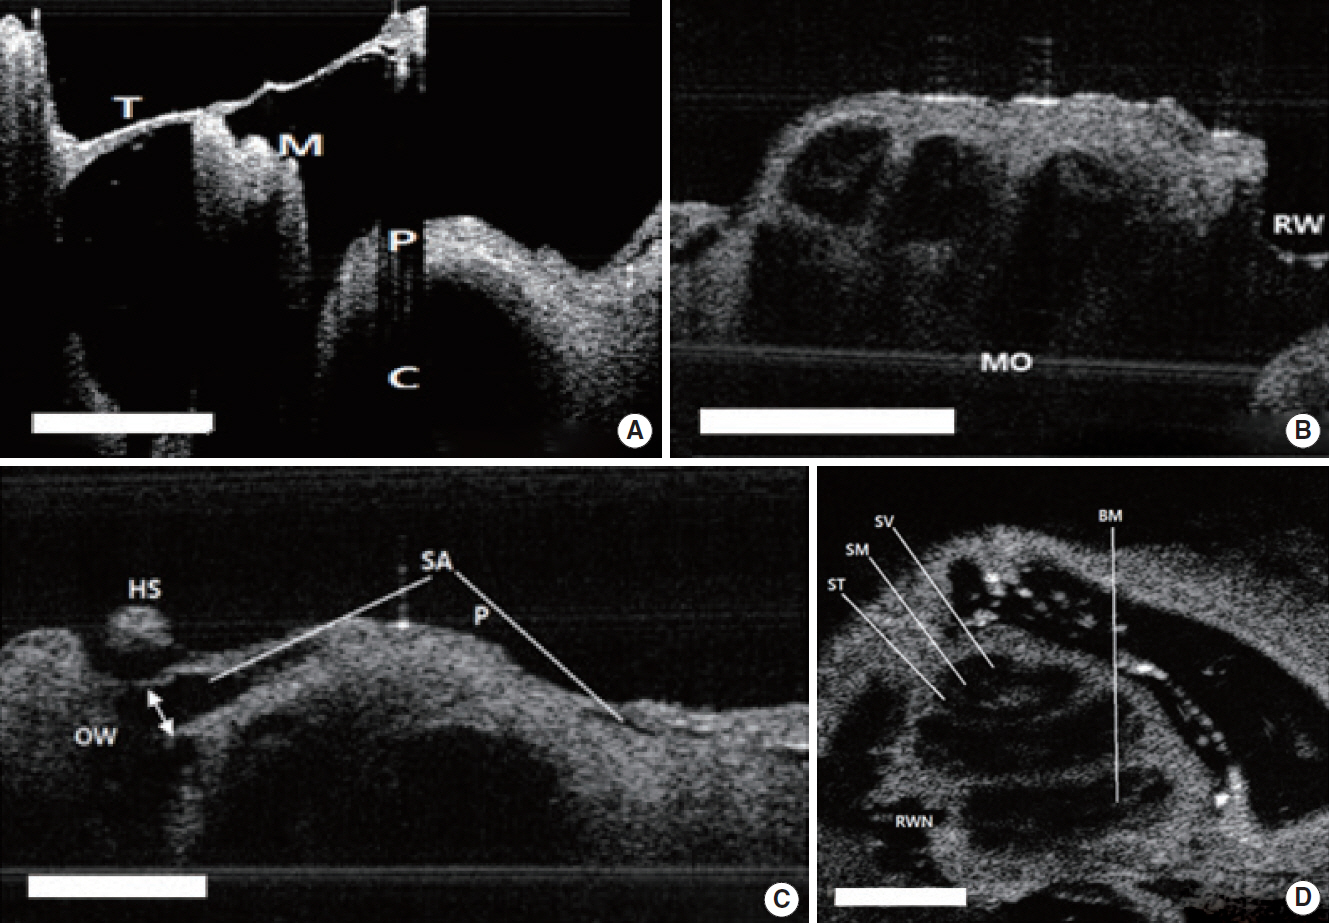
The 2D and 3D structures of middle and inner ear were visualized via the extratympanic approach. We were able to obtain the desired image by turning the head of the mouse in various directions. The cochlea, which consists of the scala media, scala tympani, scala vestibuli, basilar membrane, and Reissner’s membrane, could be observed via OCT (Fig. 4A). However, we could not confirm every turn of the cochlea in the mouse except the apical turn of cochlea. Therefore, the bony thickness covering the cochlea could be measured only at the apical turn, 16±3 µm. In the H&E stain, the same anatomic site was measured as 23± 4.0 µm, which showed no significant difference compared to OCT image (P=0.488). The 3D reconstructed image using the 2D OCT images enabled confirmation of the TM and its internal structures more clearly (Fig. 4B). The middle ear structures involving the ossicles (malleus, incus, and stapes), could be visualized (Fig. 4C).
Rat
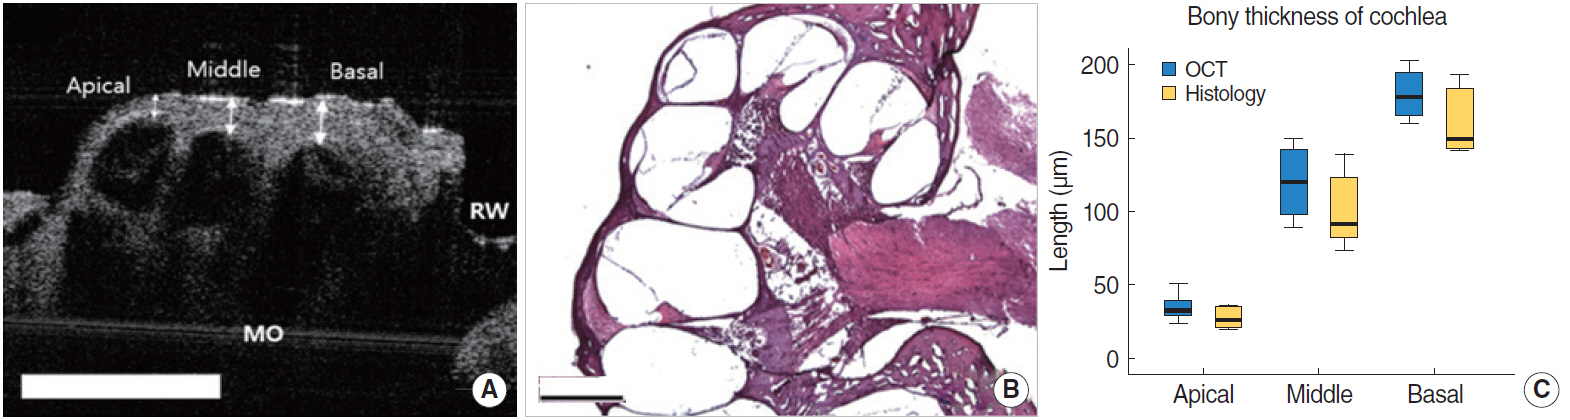
Fig. 5A shows the 2D tomographic images of middle ear morphologies including the TM and the handle of malleus, which connects the TM and the ossicles to the top part of the TM and middle ear. Although some parts of the cochlea were seen via the extratympanic approach, there were restrictions for visualizing the whole middle and inner ear structures due to the bony part of external auditory canal. We could identify these structures after bulla removal (Fig. 5A). Although the inner fine structures of the cochlea, such as the Reissner’s membrane and basilar membrane were not shown as clearly as in the mice, each of the cochlear turns and compartments, such as the scala tympani, scala vestibuli, and scala media, were visible (Fig. 5B). The bony thickness covering the cochlea could be measured by OCT from the apical turn, middle turn, and basal turn, and they were 34.9±9.5 µm, 120±23.8 µm, 179.8±17.6 µm, respectively (Fig. 6A). In the H&E stain, the thickness of the apical, middle and basal turn of cochlea were measured as 27.5±7.0 µm, 100.0± 25.6 µm, 160.1±22.6 µm, respectively, which showed no significant statistical difference compared to OCT image (P=0.652) (Fig. 6B and C). Besides that, the stapedial artery, measuring 260± 31 µm, passes through the footplate of the stapes (Fig. 5C). Fig. 5D shows cochlear cross sectional images with microstructures such as the scala media, scala tympani, scala vestibuli, basilar membrane and round window niche lateral to the central axis.
DISCUSSION
OCT could be a useful imaging tool in otology for its unique characteristics of tissue penetrability, which may give additional diagnostic or therapeutic information [11,12]. Thereby, OCT could reduce unnecessary ear surgeries being performed. Namely, an explorative operation is still frequently needed to confirm the state of middle ear, and this might be replaced by OCT, which can be used to visualize the structures inside the TM. Moreover, OCT will provide better imaging for postoperative follow-up that is more difficult to identify the changes beneath the TM [13]. Drawback of OCT is that the depth of the image it produces is limited to a few millimeters due to its low permeability to tissues. Moreover, optical components and image processing techniques need to be more developed for a 3D real imaging system. The images produced also had some limitations such as post shadow imaging distortions [14].
In the present study, to assess the usefulness of OCT, we analyzed two aspects: (1) the extent of visualization of middle and inner ear viewed from outside the TM and (2) accuracy in measuring the length of each structures. Most of the structures of the middle and inner ear were clearly visualized with OCT in both mice and rats. For the mice, all the structures from beneath the TM to the cochlea were visualized clearly. The structural images of the cochlea and middle ear in mice were more detailed compared to those in rats, which might be due to relatively thicker bone of the rats. Therefore, partial removal of the bulla in rats was needed for visualization of cochlea inner structures. Although the otic capsule covering the cochlea of the rats was thicker than that of the mice, we could visualize three compartments of the cochlear microstructures from base to apex. When OCT images were compared with the histologic images in measuring length at the bones covering the cochlea, there were no significant differences between two modalities, which means that OCT is effective for measuring lengths of around 100 µm. Therefore, these results showed the accuracy of OCT images and the possibility of utilizing the OCT as measuring the middle and inner ear structures.
Utility of OCT have been reported to have the ability to show the structures of the inner ear in the mice [15]. Tona et al. [16] reported that OCT could evaluate the gross anatomy of mouse cochlea, including the Reissner’s membrane and basilar membrane, with results demonstrating endolymphatic hydrops. Cho et al. [5] demonstrated in vivo visualization of middle and inner ear structures using OCT system which was integrated to microscope. Although these studies showed noninvasive high resolution ear images, only mouse was used in the experiment. Most animal studies usually included mice as subjects because their thin cochlear bony capsules enable OCT application in vivo as a cochlear imaging modality. In the current study, we conducted various experiments using rats and mice to determine whether OCT could be utilized in diagnosing middle and inner ear diseases. We additionally included rats for further possibility that OCT could still produce images even with a thicker bony capsule covering the cochlea.
OCT in otology is expected to assist in surgery or diagnosis of middle or inner ear diseases, such as the ossicular state, middle ear effusion, otitis media infection, cochlear anomaly, and endolymphatic hydrops. Current research is going in that direction. However, there are several practical considerations that need to be overcome from a clinical perspective. Because the light used in OCT should pass through the curvature of the external canal, the OCT system combined with a surgical microscope or endoscope was developed for this purpose [5,16-19]. Microscope-integrated intraoperative OCT is already commercially available for imaging of ophthalmic surgical maneuvers [15,16,20]. Garcia et al. [21] introduced an intraoperative OCT probe used for vocal fold imaging, which could also be applied to ear imaging if modified. The working distance of the objective lens is also an important consideration for clinical application. The working distance of the OCT instrument used in this experiment was approximately 7.5 mm, which was sufficient for observing the middle and inner ear structures in mice and rats, however, the distance from the ear canal entrance to the distal side of the middle ear cavity in humans is about 40 mm. Thus, the working distance should be extended to 40 mm for clinical application. Recently, Lee et al. [18] have developed the OCT/microscope system with an extended working distance of 280 mm, which could give enough space for intraoperative manipulation, and this will be helpful for further application of OCT to human.
Unlike more commonplace retinal and skin OCT, the microstructures of interest in otology are millimeter sized and the needs for exceedingly high resolution to visualize are less than retina and skin [13]. However, the following must be considered: first, the important structures are located behind the TM; second, they are distributed throughout approximately two cubic centimeters of air-filled middle ear space; and finally, if they are to be imaged from the external auditory canal, the numerical aperture (NA) of the objective lens will need to be low to create a new set of requirements unlike other OCT applications. The NA is a dimensionless acceptance angle that characterizes the range of angles over which the system can accept light. The depth of focus is inversely dependent on the NA of imaging optics. Therefore, increasing the NA increases the resolution but decreases the depth of focus quadratically, which means we need to choose the appropriate lens according to the target [22]. Therefore, in order to extend the depth of the field, the typical NA of lenses in surgical microscope used in the middle ear should be less than 0.02 [15]. Although the NA of the lens used in this study was 0.056, which was enough for visualizing the middle, inner ears of rodents, the NA of the lens for the application to humans should be considered lessening according to the situation of the combination of the OCT system with the microscope or endoscope.
In summary, we have demonstrated that OCT could be utilized as a real time, nondestructive, noninvasive tool for visualizing the morphology of middle and inner ear of rats and mice. It is worth studying its application for humans. Thus, OCT may become a useful tool in evaluating and treating middle and inner ear structures.
HIGHLIGHTS
▪ Optical coherence tomography (OCT) could visualize the structures of the middle and inner ear from the outside of the tympanic membrane.
▪ Measuring the middle and inner ear structures by the OCT was comparable to the histologic finding, which shows the accuracy of OCT images.
▪ Rats with a thicker bone had a limitation in the visualization of the middle and inner ear compared to the mouse.