Effect of Septoplasty on Voice Quality: A Prospective-Controlled Trial
Article information
Abstract
Objectives.
The purpose is to investigate effect of septoplasty and widened nasal patency on voice quality.
Methods.
Fifty patients who undergone septoplasty were included in the study. Thirty-three people who had similar age and distribution were enrolled as control group. Before and 1 and 3 months after surgery, anterior rhinomanometry, voice analysis by Multi-Dimensional Voice Program, and spectrographic analysis were performed to patients. The recordings of /a/ vowel were used to evaluate average fundamental frequency (F0), jitter percent, and shimmer percent. In spectrographic analyses, F3–F4 values for the vowels /i, e, a, o, and u/, nasal formant frequencies of the consonants /m/ and /n/ in the word /mini/, and 4 formant frequencies (F1, F2, F3, and F4) for nasalized /i/ vowel following a nasal consonant /n/ in the word /mini/ were compared. The differences in nasal resonance were evaluated. All patients were asked whether change in their voices after the surgery. Preoperative and postoperative voice parameters and anterior rhinomanometry results were compared separately with the control group as well as in the patient group itself.
Results.
Preoperative total nasal resistance (TNR) values of patients were higher than the control group (P=0.001). TNR values of patients measured one day before surgery and after surgery in the 1st and 3rd months were different and these differences were significant statistically (P=0.001). There was no significant difference between the voice analysis parameters in preoperative, postoperative 1st, and 3rd months. As a result of their subjective reviews, 12 patients (36%) noted their voices were better than before surgery and 20 patients (61%) noted no change before and after surgery.
Conclusion.
Providing widened nasal cavity has no effect on voice quality.
INTRODUCTION
Nasal obstruction is one of the common complaints of patients visiting otorhinolaryngology clinics and the one of main reasons of nasal obstruction is nasal septal deviation [1]. Septoplasty is a well-known surgical procedure for management of nasal septal deviation [2]. This minor surgical procedure is performed to widen the nasal passage, which in turn alters the resonance characteristics of the vocal tract [3].
Voice disorders can affect patient’s quality of life. According to a study reported by Behlau et al. [4], patients with unnatural speech are evaluated as less attractive and less intelligent than people with normal speech and this apprehension can affect social life and life quality of these patients. Nasal obstruction may play an important role in the feature of voice [5]. There are not many reports about acoustic features of the voice after septoplasty procedure. Normality of voice, grade and cause of voice disorders, and effect of treatment especially in clinical trials can be evaluated by voice analysis methods [6].
We aim to evaluate the relationship between widened nasal cavity and voice quality by voice analysis method, spectrography and subjective questions in patients undergone successful septoplasty procedure.
MATERIALS AND METHODS
A prospective-controlled trial was performed between January 2014 and December 2014 in a 3rd stage hospital. It was approved by local ethical committee (2012/313). Written informed consent was obtained from all patients.
Design
Fifty patients who have septal deviation were included in the study. None of them was a voice professional. Septal deviation was diagnosed by anterior rhinoscopy and nasal endoscopy. Patients and 30 voluntary people who had similar age and sex distribution and no nasal obstruction, septal deviation, laryngeal disease, and voice disorder were also included as control group. People who have nasal operation history before, allergic rhinitis, cranio-facial anomaly, neurological disease, laryngeal pathology, nasal pathology except septal deviation, and those younger than 18 age excluded. After the operation, patients who did not come to their postoperative controls, had septal perforation and higher total nasal resistance (TNR) value than avarage value of control group were also excluded. When postoperative TNR value of a patient was less than avarage TNR of control group, this operation was accepted as successful septoplasty. The study was continued with successful operations. Because we aimed to evaluate the effects of increased nasal patency on voice quality.
Anterior rhinomanometry
It was used to measure grade of nasal obstruction. Before it, agents that may affect the results like smoking, decongestant, and antihistamines were excluded. Measurements were performed by Homoth Rhino 4000 device (Homoth, Hamberg, Germany) under 150 Pascal pressure defined by International Organization for Standardization. Both resistance of nasal airways were seperately calculated with the inspiration values using the formula R=∆P/V. Then, TNRs were calculated using the formula 1/R (total)=1/r (left)+1/r (right) [2]. Results were recorded.
Voice record and acoustic analysis
Multi-dimensional Voice Program (MDVP) (Kay Elemetrics Co., Lincoln Park, NJ, USA) and a microphone (Shure SM-48; Shure Inc., Niles, IL, USA), with a standard soundboard (Sound Blaster Live Value, Creative Technology Ltd., Jurong East, Singapore) were used for recording. The recordings were made in an isolated room using a microphone at a constant mouth-to microphone distance (15 cm). For the standardization and comparability of the voice samples, the patients and volunteers were instructed to sustain the vowels at a comfortable pitch and level of loudness three times before recording to obtain maximum steady phonation during recording. Before and 1 and 3 months after operation, phonetically balanced sentences and the vowel /a/, followed by vowels /i/, /e/, /a/, /o/, and /u/, then a word /mini/, which contains nasal consonants /m/ and /n/ and nasalized vowel /i/ articulated with a comfortable speech voice were for 5 seconds recorded and digitalized in all patients for an evaluation. Linear predictive coding analysis was used to obtain formant frequencies.
All patients were performed septoplasty by the same surgical team. Radiofrequency ablation was applied the inferior turbinate on the opposite site of septal deviation if necessary. One and 3 months after surgery, physical examinations and anterior rhinomanometry (ARM) were again done. All patients were asked whether changes in their voice with open questions as no change, better than preoperative and worse than preoperative. These procedures were also performed to control group. Preoperative and postoperative voice parameters and ARM results were compared separately with the control group as well as in the patient group itself.
Statistical analysis
Preoperative and postoperative voice analysis results of patients were evaluated with the control group and in the patient group itself: basic frequency (F0), jitter %, shimmer % and noise to harmonic ratio (NHR) values for /a/ vowel; F3-F4 formant frequency values for /n/ nasal consonant; and F1-F2-F3-F4 formant frequency values for nazalized /i/ in /mini/ word in preoperative, postoperative 1st and 3rd months were compared with the control group and in the patient group itself.
All data were evaluated in IBM SPSS ver. 21.0 (IBM Co., Armonk, NY, USA) statistical pocket program. Categorical data were evaluated by Fisher exact chi-square test. Distributions of normality were tested by Shapiro-Wilk test. Independent samples t-test, one-way analysis of variance, repeated measures analysis of variance, and parametric Student-Newman-Keuls multiple comparisons tests were used in normal distributed data. Mann-Whitney U-test, Kruskal–Wallis H-test, Friedman test, and nonparametric Student-Newman-Keuls tests were used in abnormal distrubuted data. P<0.05 value was considered significant statistically.
RESULTS
There were 29 men and 21 women in the study group. None of them was applied sinus surgery. Seven patients who did not come to their postoperative controls, 3 patients who were observed septal perforation after septoplasty and could not be done ARM due to perforation, and 7 patients who had higher TNR value than avarage TNR value of control group were excluded. There were 9 patients applied radiofrequency ablation and all of them was in excluded group. Except absent patients, successful septoplasty rate was 77%. The study was conducted with 33 patients who have an increased nasal patency.
Nineteen men (58%) and 14 women (42%) were enrolled as patient group and the mean age of patients was 25 years (range, 18 to 53 years). The mean age of control group was 27 years (range, 18 to 51 years) and there was no significant difference in terms of age and sex between patients and the control group (P<0.05) (Table 1).
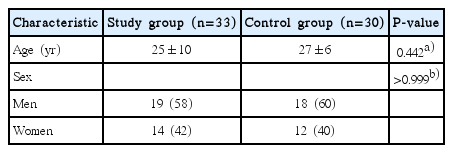
Age and sex distrubition of study and control groups
Preoperative mean TNR value of patients was higher than the control group’s and this difference was significant statistically (P=0.001). Preoperative TNR values of patients decreased post-operatively and these differences were again significant statistically (P=0.001) (Table 2).

Comparison of TNR values of study groups in their own and with control group
When asked patients whether changes in their voices after surgery, 20 patients (61%) noted no change, 12 patients (36%) said there was a change in a good way, and one (3%) noted a change in a bad way.
Compared analysis results of /a/ vowel, there was no significant difference between the values before and 1 and 3 months after surgery (Table 3). Compared these results with the control group, there was no significant difference except NHR value (P=0.017). This difference was not reviewed, because it was not related to change of TNR.

Comparison of /a/ vowel’s voice analysis results of study group in their own and with control group
Compared analysis results of /n/ nasal consonant; there was no significant difference between the values before and 1 and 3 months after surgery. Compared these results with the control group, there were significant differences statistically about F3 formant freqency in postoperative 1st and 3rd months (P=0.022, P=0.024) and F4 formant frequency in postoperative 1st month (P=0.017) (Table 4). These differences were not significant clinically because these frequencies had not significant change in patient group.

Comparison of /n/ nasal consonant’s voice analysis results of study group in their own and with control group
Compared analysis results of /mini/ word, there was no significant difference postoperative and with the control group (Table 5).

Comparison of /mini/ word’s voice analysis results of study group in their own and with control group
DISCUSSION
ARM is most frequently used to evaluate preoperative nasal obstruction level and postoperative operation success in people performed septoplasty [7-9]. The most important value obtained from ARM is TNR [10]. TNR value and sensation of nasal obstruction are significantly related [8]. In this study, preoperative mean TNR value was 0.42 Pa/mL/sec and it was 0.25 postoperative. This difference was significant statistically (P<0.05). Postoperative mean TNR value of patients was even better than the control group (P<0.05).
Operations about vocal folds can change voice quality to effect acoustic parameters formed by vocal folds movement and defined MDVP (F0 and F0 related parameters jitter–shimmer). There is an opinion surgical procedures about pharynx, oral, and nasal cavity can affect voice quality and resonance changing shape and size of acoustic area [3,11,12]. For this reason, voice changes must be considered in larynx and upper airway surgical procedures.
Evaluating of human voice is very difficult because of multidimensional nature of sound signals and variety of physical aspects. Objective assessment of voice is essential to expose voice disorders and to comment therapeutic results about voice. Subjective opinions of patients especially postoperative are not satisfying, because they can not realize minor changes. For this reason, acoustic analysis is used to evaluate voice changes objetively [13]. There are a lot of program doing acoustic analysis but the most used program is Computerized Speech Lab (CSL) and MDVP working on CSL [14]. Plenty of parameters can be calculated on MDVP but the most used parameters are F0, NHR, jitter, and shimmer [15].
A study reported by Petrovic-Lazic et al. [16] including 46 patients have vocal polyp and treated by cold technique and another study reported by Geyer et al. [17] including 235 patients have benign glottic lesions and treated by CO2 laser defined significant difference between preoperative and postoperative values of Fo, jitter, shimmer, and NHR. A study reported by Brosch et al. [18] in 2000 defined no significant difference about acoustic parameters except F0 after uvulopalatopharyngoplasty.
MDVP can expose voice changes in laryngeal disorders and surgical procedures performed on larynx. MDVP is the first used method to evaluate effect of upper airway surgeries on voice in the literature. There was not significant difference about voice quality in these studies.
There are very few studies assessing nasal resonance and laryngeal functions together in the literature. Both of them were evaluated together in this study. In a study reported by Mora et al. [19] in 2009, they evaluated objectively patients’ voice by MDVP one month after septoplasty. There were significant differences in F0, jitter, shimmer, and NHR values. Compared with their control group, there was no significant difference.
Changes in nasal resonance after upper airway surgical procedures were defined in a lot of study. Andreassen et al. [20] found significant differences about nasality after adenoidectomy; Chen and Metson [21] defined significant promotion in formant amplitude of nasal consonants (/m, n/) after functional endoscopic sinus surgery; Behrman et al. [3] determined statistically significant increase in formant amplitude of nasal consonants after upper airway surgeries.
We expected change in F3-F4 formant frequencies, because they are related to nasal cavity and paranasal sinuses. But there was no significant diffence both F3-F4 formant frequencies of /n/ nasal consonant and F1-F2-F3-F4 formant frequencies of /mini/ word including nasalized /i/ after septoplasty. There are different results in the literature about effect of upper airway surgical procedures on nasality and nasal resonance. Using different voice analysis method, differencies in voice analysis methods and postoperative time of evaluating effect of operation could be reasons for this. Depending on wound healing and edema, nasal patency can not be enough postoperative. For this reason, voice analysis must be performed in a late period like 3rd or 6th months postoperative.
Ozbal et al. [5] have reported a new study investigating effect of septoplasty on voice and speech in a 20-patient group. They did voice analysis preoperative and postoperative 1st and 3rd months and determined septoplasty has no effect on voice and speech [5]. But this study has no control group. In addition, success of septoplasty was not evaluated. Our presented study has compared values of patients and control group and evaluated success of septoplasty by ARM objectively.
In conclusion, a widened nasal cavity has no effect on voice quality and procedures about nasal obstruction like septolasty could be performed safely. But more comprehensive studies are needed about this issue.
HIGHLIGHTS
▪ Voice quality before and after septoplasty was prospectively measured in patients with septal deviation.
▪ Postoperative total nasal resistance (TNR) did not significantly differ between 33 study patients and 30 healthy volunteers.
▪ Preoperative but no postoperative objective voice parameters differ between study and control groups.
Notes
No potential conflict of interest relevant to this article was reported.