


INTRODUCTION
A number of studies have reported various electrophysiological measures in cochlear implant (CI) recipients, attempting to correlate these findings with auditory nerve functionality. The electrically evoked compound action potential (ECAP) is the measure most frequently recorded in routine clinical settings. Since 1990, the intracochlear ECAP measurement technique has been employed to capture the evoked whole-nerve action potentials, utilizing the multichannel CI’s own intracochlear electrodes as recording electrodes [1]. Furthermore, the advent of telemetry systems for intracochlear ECAP recording has simplified and expedited the process [2]. However, this ECAP measurement, which necessitates the use of an intracochlear array, is not accessible prior to implantation. As an alternative, the electrically evoked auditory brainstem response (EABR) can be recorded for both intracochlear and extracochlear stimulation, using scalp-mounted electrodes to gauge responses from the auditory nerve [3-9].
Preoperative EABR with extracochlear stimulation (eEABR) can be obtained through either promontory stimulation or round window (RW) stimulation. While promontory stimulation is a minimally invasive method to activate the cochlea, it is believed that precise electrode placement at the RW may yield more consistent stimulation [10]. Furthermore, Fernandez et al. [9] have shown that bipolar stimulation, with one electrode over the RW and another over the promontory, results in clearer eEABR recordings compared to monopolar stimulation. However, these studies have primarily concentrated on the presence or absence of a reproducible eEABR wave, rather than on characteristics of the eEABR such as the slope of the amplitude growth function (AGF). Smith and Simmons observed that an ear with only 5%–10% of its spiral ganglion neurons (SGNs) intact could still produce an EABR with normal thresholds but with reduced AGF slopes [11]. In animal studies, steeper EABR AGF slopes have generally been associated with a higher density of SGNs [11-13]. These studies have also indicated that EABR characteristics can vary with the site of stimulation [14,15]. To our knowledge, no studies to date have investigated the relationship between eEABR slopes and SGN functionality in connection with different cochlear sites.
The distribution and survival of SGNs likely vary among patients. Consequently, for users of multichannel CIs, the health of the neural population relative to electrode placement may correlate with the number of functional channels and overall CI performance. Our goal was to develop preoperative testing tools that utilize the eEABR to estimate the number and distribution of excitable functional neurons in individual subjects. In this study, we used both intracochlear and extracochlear electrodes in a bipolar configuration to investigate the eEABRs/EABRs elicited at various sites within the rat cochlea, which exhibited different levels of SGN degeneration.
MATERIALS AND METHODS
Subjects
Sixteen male Sprague-Dawley rats (297–485 g) were used in this study. Experiments were conducted in nine rats with normal hearing and seven rats that were partially deafened. Each experiment involved the following steps in common: (1) To avoid a short circuit current caused by leaked perilymph, eEABR recordings were performed first. The extracochlear electrode was placed at three different sites along the axis of the cochlea. (2) Thereafter four-channel intracochlear electrode arrays were implanted through cochleostomies. EABRs were recorded in response to various electrode combinations for bipolar stimulation. Experiments in normal-hearing rats focused on optimizing extracochlear stimulation parameters and identifying related electrode configurations between two stimulating systems, whereas experiments in partial-deaf rats focused on the relationship between the eEABR and surviving SGNs. The Institutional Animal Care and Use Committee approved the care and use of the animals (MRI-2022-0002). All procedures were conducted according to institutional guidelines.
Ouabain treatment
In the partial-deaf group, thresholds of tone-pip auditory brainstem responses (ABRs) between 4 kHz to 32 kHz were measured immediately before and 72 hours following ouabain treatment. The tone level varied for each frequency from 90 dB SPL to 20 dB SPL in 10 dB steps. ABRs were recorded in a soundproof chamber using needle electrodes placed on the vertex, behind the pinna of the ipsilateral and contralateral ear (active, reference, and ground, respectively).
For deafening procedures, animals were anesthetized with isoflurane inhalation (1%–3%). After a retro-auricular incision, the tympanic bulla was opened to expose the RW. Under the operating microscope, the RW niche was filled with 10 mM ouabain solution (Sigma Aldrich).
Surgical procedures
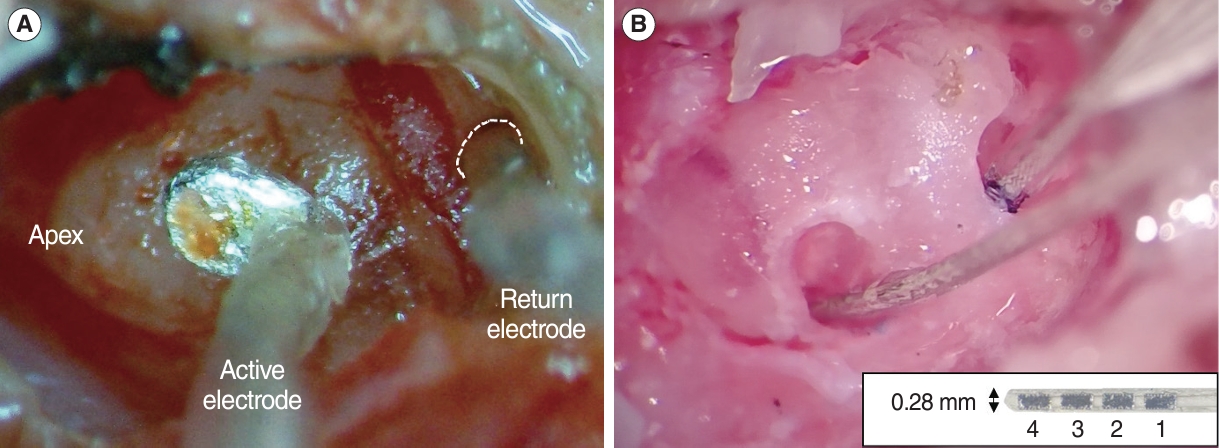
Animals were anesthetized with a mixture of ketamine (80 mg/kg, i.p.) and xylazine (10 mg/kg, i.p.). After induction of anesthesia, a head post was anchored to the skull with stainless steel screws and dental cement. A small craniotomy was performed on the left temporal bone to expose the dura for a portal to the recording electrode. Then, the tympanic bulla was exposed using a retro-auricular approach and opened widely. For extracochlear stimulation, we designed a raddle-shape active electrode with a Teflon-coated silver wire (381 μm in bare diameter), which was placed on the outside wall of the cochlea by a micromanipulator after the head was immobilized by a head post holder, and a silver ball return electrode (ϕ 250 μm), which was fixed at the RW by tissue adhesive (Fig. 1A). Care was taken to prevent rupturing the RW membrane. After eEABR recordings, two small cochleostomies were created for intracochlear stimulation. A 4-channel custom intracochlear array (TODOC) was used, it consists of four platinum–iridium contacts on a 0.28 mm-wide silastic carrier (Fig. 1B). The dimension of each contact is 0.18×0.36 mm2 and the gap between contacts is 0.12 mm. Two intracochlear arrays were implanted into the scala tympani of the basal and middle turns, respectively.
eEABR/EABR measurements
The procedure for eEABR/EABR recording was the same as for ABR, except for the placement of an active electrode into the craniotomy, which improves signal quality. Electrically evoked responses were obtained using the forward masking subtraction method in the linked masker condition to minimize stimulus artifacts [16]. All responses reported in this study were recorded using the cathodic-leading biphasic current pulse presented in bipolar mode because it more accurately controlled the spread and location of activation compared to monopolar mode [17]. The most basal intracochlear electrode (B1) was always employed in bipolar mode with any other electrode in the basal array (B2-B4) or the most apical one in the middle array (M4) as the simulating electrode pair. For extracochlear stimulation, bipolar stimulation was achieved by serving the extracochlear electrode as the active electrode, which was referenced to the ball electrode at the RW. For all bipolar pairs used in this study, the pulse was fixed at relatively long durations of inter-phase gap (120 μs) and stimulus phases (120 μs) to reduce the current level producing the maximum response and not to change the range of input currents individually. Regardless of the type of stimulation, the masker-probe interval was fixed at 800 μs. Electrical stimuli were delivered from 100 μA to 1 mA in 2 dB steps.
Data analysis
A custom-designed program in MATLAB was used to manually mark the positive and negative peaks. Because the early components of the EABR were generally obscured by the residual stimulus artifacts, the late waves observed after 2 ms from the stimulus onset were considered. The contribution of the myogenic response was negligible by the facial nerve section, and the N3 and P4 peaks were reliably evoked at high intensities (Fig. 2A). Therefore, the N3-P4 amplitude was selected to compute AGFs. Within each subject, all amplitudes for the given stimulus conditions were normalized to the highest amplitude value observed for all tested stimuli. Then, the slope characteristics were calculated by fitting the normalized AGF to a Boltzmann sigmoidal equation (Fig. 2B) [18].
Histological analysis
The histological evaluation was performed in seven cochleae harvested from the partial-deaf group. After the final EABR recording session, the animals were perfused intracardially with phosphate-buffered saline followed by 10% neutral buffered formalin. After intra-labyrinthine perfusion and overnight immersion in the same fixative, the cochleae were decalcified and embedded in paraffin. Sections were cut at a thickness of 4 μm in the mid-modiolar plane, and every tenth section was collected and stained with hematoxylin and eosin. Using a light microscope equipped with a digital camera, digital images of the sections were acquired. To evaluate the SGNs in four regions of Rosenthal’s canal from the lower basal turn to the apex, 3–5 sections through the modiolus were selected for each cochlear region. The SGNs identified with a clear nucleus were counted, and the area of Rosenthal’s canal was measured using cellSens software (Olympus). For each region, the mean density of SGN was calculated.
Statistical analysis
Pearson’s correlation coefficients or Spearman Rho correlation coefficients were computed to assess the correlation for all possible pairwise combinations between eEABR slopes and EABR slopes and between eEABR/EABR slopes and ABR thresholds. Prior to each test, data were checked for normality using the Shapiro-Wilk test. Nonparametric statistics were used when the normality assumption did not hold because of the small sample sizes and large subject variability. All statistical analyses were performed with the IBM SPSS statistics (IBM Corp.). The level of statistical significance was set at P-value <0.05.
RESULTS
The initial data set was gathered from nine rat ears that exhibited normal hearing thresholds before undergoing surgery. Two ears yielded incomplete data sets due to a partial malfunction in the implanted electrode array. Furthermore, AGF recordings that lacked sufficient data points for curve fitting were omitted from subsequent analyses. The remaining AGFs from both EABR (30/36) and eEABR (27/27) recordings typically conformed well to a sigmoidal function, yielding a total of 57 slope characteristics. All normalized slope values followed a normal distribution.
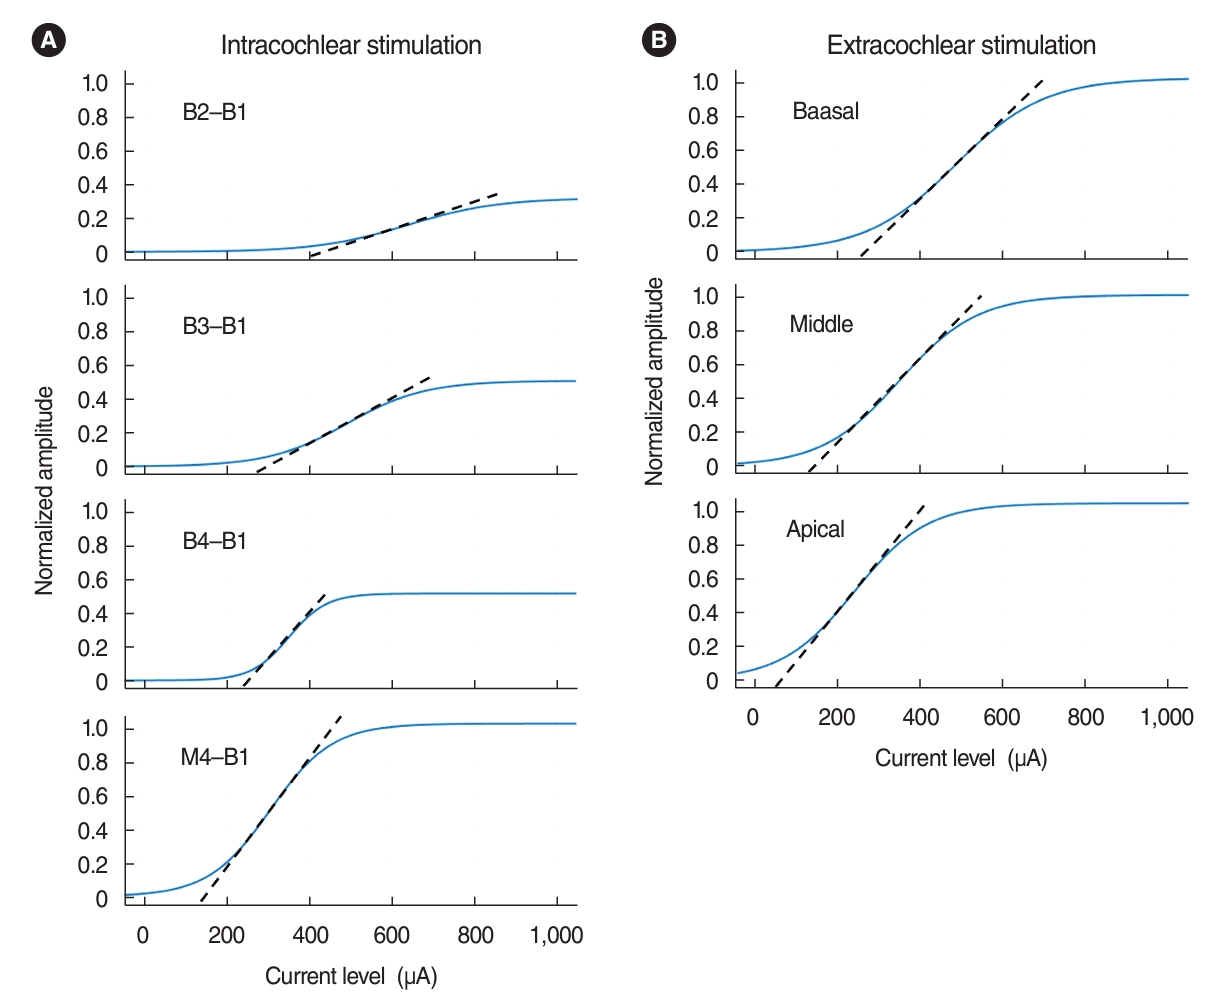
Examples of AGFs obtained from both intracochlear and extracochlear stimulation are shown in Fig. 3 for each electrode pair. While return electrodes were fixed at the most basal site, active electrode positions used for bipolar stimulation varied in the basoapical direction. For both EABR and EABR, significant changes in AGFs occurred with different electrode positions. AGFs obtained with the most basal and narrowly spaced electrode pair had the smallest amplitude and the shallowest slope. Stimulation with the wide electrode pairs yielded a relatively low threshold, large response amplitude, and steep slope.
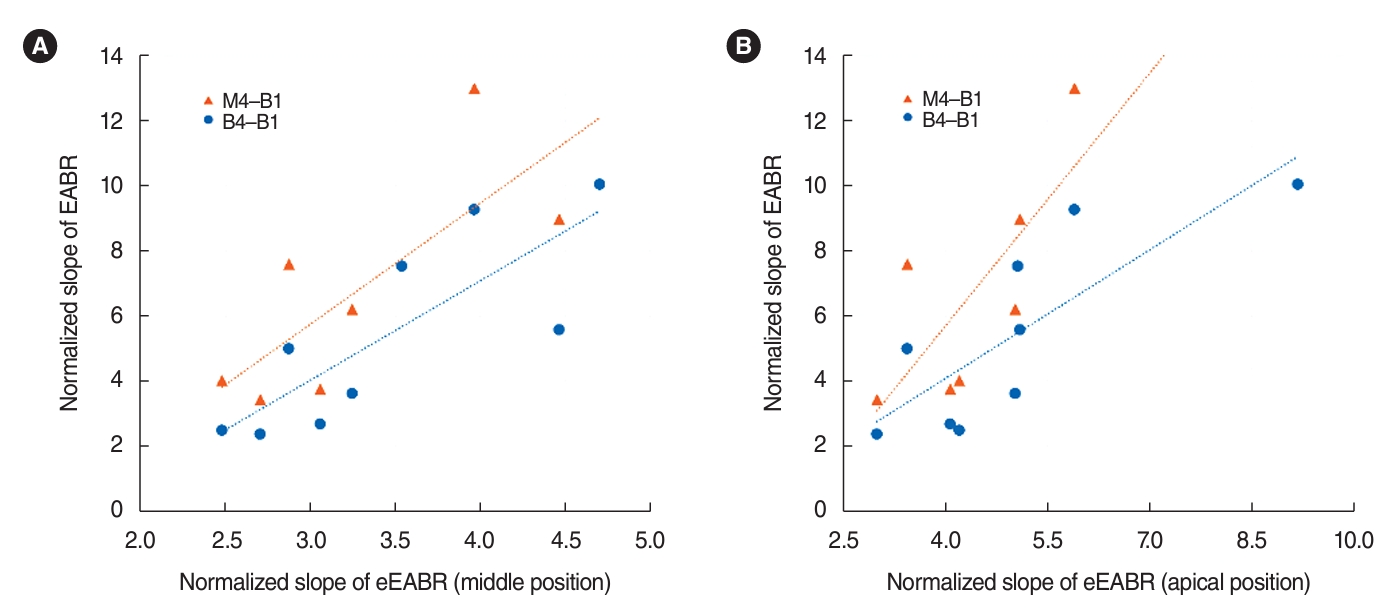
In order to determine the comparability of EABR and eEABR, we examined the correlation between normalized slopes (amplitude/mA) of intracochlear and extracochlear electrode pairs, as shown in Table 1. We found that the eEABR slopes at the apical or middle positions were significantly positively correlated with the EABR slopes from the two most widely spaced intracochlear electrode pairs (B4-B1 and M4-B1), as depicted in Fig. 4. The slope values of the linear regression trendlines exceeded 1, suggesting that the EABR AGFs had relatively steeper slopes than those of the eEABR AGFs. Although the eEABR slope at the basal position correlated with the EABR slope from the second most narrowly spaced electrode pair (B3-B1), it did not show a correlation with the EABR slope from the narrowest pair (B2-B1, 0.12 mm). In contrast, the EABR slopes for the B2-B1 electrodes (0.85±0.32 per mA) were significantly shallower than the eEABR slope at the basal position (2.47±0.85 per mA) (t(7)=8.798, P<0.001).
A subset of seven ears with initial ABR thresholds of 30 dB or less was used to assess the changes in tone ABR thresholds following ouabain treatment (Fig. 5). Among the seven animals treated with 10 mM ouabain, four exhibited profound elevations in ABR thresholds (≥80 dB) at high frequencies (20–32 kHz). The remaining three animals showed moderate elevations in ABR thresholds at frequencies of 24, 28, and 32 kHz, with thresholds ranging from 40 to 60 dB. Low-frequency hearing was generally unaffected, as all seven animals demonstrated ABR thresholds below 40 dB at frequencies of 4 and 8 kHz. Additionally, mean SGN densities in Rosenthal’s canal were measured in the lower and upper basal turn, the middle region of the second turn, and the apex of the cochlea in both the experimental ears and the contralateral untreated ears of each subject in the partial-deafness group. Histological data from one animal was incomplete due to damage to the bony wall of Rosenthal’s canal during histological preparation. The percentage of SGN loss is plotted as a function of frequency corresponding to each cochlear region, using the place-frequency map of the rat cochlea [19] (Fig. 5). SGN loss induced by ouabain varied among subjects and cochlear regions. Typically, a more severe reduction in SGN density was observed in the basal regions of the cochlea, while little to no SGN loss occurred in the apical region.
Although the results suggest that the shift in ABR threshold visually appears to correlate to a similar degree with SGN degeneration, ABR using tone stimuli may be more sensitive in assessing the place-specific status of neural health, rather than merely neural survival, in this animal model of partial auditory neuropathy. Consequently, we explored the relationship between eEABR data and frequency-specific ABR data. The correlations between the slopes of eEABR AGFs obtained at three different positions and the frequency-specific post-treatment ABR thresholds are shown in Table 2. We conducted a Spearman nonparametric correlation analysis because the ABR thresholds measured at high frequencies (24–32 kHz) did not follow a normal distribution across subjects.
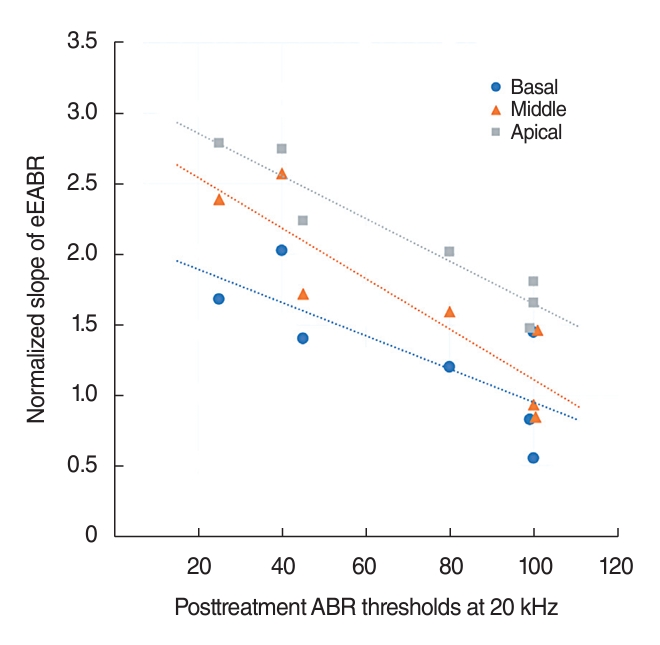
The ABR thresholds at several frequencies had a significant negative correlation with the eEABR slopes of each extracochlear electrode at the apical, middle, and basal positions. This indicates that ears with more severe hearing impairment, which depends on the neural health of the corresponding cochlear region, tended to exhibit shallower eEABR slopes compared to ears with milder hearing loss. For example, the eEABR slope for each electrode position is graphically represented as a function of the ABR threshold measured at 20 kHz in Fig. 6. Additionally, the influence of extracochlear electrode positions on the correlation between eEABR slopes and ABR thresholds was generally more pronounced at the apical and middle positions than at the basal position. Similarly, the frequency range that showed a significant correlation with eEABR slopes for the apical and middle electrodes was broader, encompassing both lower and higher frequencies, than the range for basal electrodes, which was 16–24 kHz for basal electrodes and 12–32 kHz for middle and apical electrodes.
To facilitate comparisons between the coefficients for extracochlear stimulation and intracochlear stimulation using implanted electrodes, we have included the correlations for the EABR slopes in Table 2. The correlation coefficients for the ABR threshold/eEABR slope relationship were significantly higher than those for the ABR threshold/EABR slope relationship. Out of 32 combinations of ABR threshold and EABR slope, only two combinations at the frequency of 16 kHz showed statistical significance. In this study, the variability in posttreatment ABR thresholds across animals was highest for mid-frequency tones (16 and 20 kHz). Notably, there was no significant correlation for EABR slope data obtained with the most widely spaced intracochlear electrodes (M4-B1), which contrasts with the direction of the eEABR results.
DISCUSSION
In this study, we compared the characteristics of ABR slopes evoked by two different types of electrical stimulation—extracochlear and intracochlear—in the same subjects. For each stimulation type, we targeted various regions of the cochlea using several bipolar electrode pairs at different positions. Our objectives were to determine which combinations of bipolar pairs show correlations between eEABRs and ABRs, and to assess whether eEABR slopes could serve as predictors of site-specific neural status prior to implantation surgery. The findings indicate that there are similar trends in slope changes at different stimulation sites for both types of stimulation in animals with normal hearing, specifically a monotonically increasing slope with a greater distance between bipolar pairs. These trends align with the hypothesis that the amplitude of the response evoked at different stimulation sites reflects the number of neurons responding within the portion of the cochlea spanned by an electrode pair [20-22]. Furthermore, significant correlations were observed between eEABR and ABR slopes when the cochlear regions expected to be stimulated were similar under normal SGN conditions. The selective loss of SGNs induced by ouabain within three days allowed for comparable measurements of the ABR without the expectation of plastic changes in the central auditory system as a result of peripheral lesions. As a result, stimulating increasing regions of the cochlea revealed a differential impact on eEABR slopes in partially deaf animals, and the electrophysiological findings corresponded well with the locations of excitable SGNs. Based on these results, eEABR slopes measured at various cochlear positions may provide preoperative spatial information about the extent of excitable SGNs in CI candidates.
For extracochlear stimulation, we observed systematic changes in eEABR slopes corresponding to different extracochlear electrode positions in both normal-hearing and partial-deaf groups. As illustrated in Fig. 2A, the eEABR AGFs obtained with the electrode positioned at the base of the cochlea showed a higher threshold and a more gradual slope compared to other extracochlear electrode positions. These observations may shed light on the occurrence of false negative results in promontory stimulation tests (11%–26%) reported in human clinical studies [6,23]. Nikolopoulos et al. [6] recorded eEABRs evoked by promontory stimulation and found that all 12 children who did not exhibit a clear response still derived significant benefits from CI. In promontory stimulation, the electrical stimulation is typically applied to the basal region of the cochlea, with an electrode location near the RW that is not precisely determined. It might be assumed that the bony wall of the cochlea would impede the transmission of electric current to the SGNs [24], yet studies comparing direct RW stimulation with promontory stimulation have not shown significant differences in outcomes [25,26]. Furthermore, Cousillas et al. [27] suggested that direct current injection at the RW had a highly localized effect on the basal turn and no effect on the apical turn. Contrary to these previous studies, our stimulations were administered to all three cochlear turns and were evaluated over a broad range of current intensities (up to 1 mA). Our findings indicate that extracochlear stimulation at the basal position elicited significant responses only at high current intensities. Consequently, our data suggest that negative results from promontory stimulation could be due to the need for higher current levels to stimulate SGN in the basal region. Placing the electrode on the middle or apical turns required lower intensities to elicit a clear response and produced effects that were less localized than when the electrode was placed on the basal turn. Therefore, if eEABR is employed as a preoperative test to assess SGN functionality, a negative eEABR result from promontory stimulation should be followed by additional testing with stimulation at the middle turn, or at the very least, at an upper basal turn that is distant from the RW.
In partially deaf animals, we found that responses to extracochlear stimulation correlated more strongly with neural health than did responses to intracochlear stimulation. Contrary to the intuitive expectation that electric currents delivered to electrodes in the scala tympani would more effectively reach the target SGNs, our study revealed the opposite outcome. This discrepancy could be attributed to the shallow insertion depth of the intracochlear electrode array, which was only about 3 mm from the RW, even when inserted via cochleostomy. According to Müller’s equation, the estimated region of the most apical electrode in the basal array (B4) corresponded to the 2,325 kHz region in rats [19]. After ouabain treatment, four subjects exhibited very high ABR thresholds at 24 kHz (>100 dB), indicating that only three subjects (43%) retained excitable neural tissue at the basal array stimulation site. Furthermore, we employed straight electrode arrays that were positioned along the lateral wall of the cochlea, which increased the distance between the electrodes and the modiolus. Consequently, the shunting of currents between electrodes in the highly conductive perilymph is likely to raise thresholds and reduce the current density reaching the neural tissue, particularly in the basal cochlea where the scala is relatively wide. However, neither of these explanations can account for why the EABR slopes obtained with the most widely spaced electrodes (M4-B1) did not correlate with ABR outcomes across all frequencies. While we did not investigate the tonotopic selectivity for each electrode pair stimulation, the likely explanation appears to be the wide separation between electrodes itself. Spatial tuning curve (STC) data from guinea pigs have demonstrated that increasing electrode separation leads to broader excitation patterns and reduced selectivity [17]. To validate this hypothesis, further STC studies using extracochlear electrodes should be conducted.
In conclusion, this study suggests that preoperative eEABRs may serve as a potential tool for assessing the neural integrity of CI candidates. However, the absolute eEABR measurements are affected by individual differences in recording conditions. To mitigate the variability arising from non-neural factors, we normalized the AGF to the maximum amplitude value. Despite this normalization to facilitate comparisons between subjects, we were unable to determine an optimal cut-off value for each electrode position that could reliably distinguish between healthy and non-responsive neural areas. Therefore, caution must be exercised when interpreting the slope measure derived solely from the AGF. As indicated in Table 3, considering the changes in the ratio of slopes measured at different electrode positions may be more suitable for clinical use. When the active stimulating electrode is positioned within a healthy neural region, the ratio is likely to be higher than those measured across degenerated neural regions. It is important to note that, since human anatomy features thicker bone (0.6–1.6 mm) and a less protruding cochlea compared to rats [28], the applicability of this comparison method must be validated in future clinical studies.
HIGHLIGHTS
▪ The preoperative electrically evoked auditory brainstem response with extracochlear stimulation (eEABR) could serve as a tool for assessing the neural health of cochlear implant candidates.
▪ The eEABR correlated well with the electrophysiologic characteristics obtained with intracochlear arrays when the expected cochlear regions of stimulation were similar.
▪ The slope characteristics measured from eEABR growth functions at various cochlear positions showed significant spatial correlations with auditory nerve functionality.