Association of Bone Mineral Density With Hearing Impairment in Postmenopausal Women in Korea
Article information
Abstract
Objectives
Previous studies examining the association between osteoporosis (OP) and hearing loss (HL) have shown conflicting results. The objective of the present study was to examine the association between hearing impairment and OP in postmenopausal women, using appropriate statistical analyses.
Methods
Total 1,009 participants were included in the current study. The propensity score matched (PSM) cohort was defined as the cohort including participants diagnosed with OP and participants without OP. Three statistical models were developed where model 1 was unadjusted, model 2 included age, and model 3 included age, body mass index, alcohol intake, smoking habit, diabetes mellitus, hypertension, high density lipoprotein cholesterol, triglyceride level, vitamin D, and alkaline phosphatase.
Results
There were 776 and 233 participants in the groups diagnosed without and with OP, respectively. For propensity score matching, 233 pairs were selected from the 776 participants without OP. In the total cohort, using statistical models 2 and 3, no significant difference in the four hearing thresholds was identified between the 2 groups. Logistic regression indicated that, in model 3, participants with OP had a 1.128 (P=0.323) increased risk HL. A significant HL risk was not observed in participants with OP. Using statistical model 3, there were no significant associations among lumbar spine or femoral neck T-scores and changes in the hearing thresholds. In the PSM cohort, statistical models also showed similar results.
Conclusion
The current study did not demonstrate and association between bone mineral density and hearing impairment in the study population of postmenopausal Korean women.
INTRODUCTION
Hearing impairment and osteoporosis (OP) are two of the most common public health problems. The prevalence of hearing loss (HL) in the United States in an advanced age population was approximately 13.7% in those 50–59 years of age, 29.3% in those 60–69 years of age, and 55.1% in those 70–79 years of age [1]. Prevalence of OP in the United States in adults 50 years of age and older was approximately 2% in men and 10% in women [2]. The prevalence of both conditions is rising rapidly with an increasingly aging population. Horner. [3] hypothesized an association between decreased bone mineral density (BMD) and hearing impairment, due to the effects of bone demineralization on the skeletal system, including the temporal bones, which surround the vestibular labyrinth and the cochlea. Therefore, decreases in BMD could adversely affect the vestibular labyrinth and hearing functions.
Previous studies examining the association between OP and hearing impairment have shown conflicting results [4-10]. Recently, a study using results of a 1999–2004 National Health and Nutrition Examination Survey, with a majority of participants self-identifying as Non-Hispanic White, demonstrated that low BMD is associated with hearing impairment [8]. In contrast, a study by Helzner et al. [5,6] demonstrated an association between the 2 variables in an African American male population, without identifying any association in African American women or Caucasian population. A study by Kim et al. [4], including only a Korean postmenopausal population, did not demonstrate association between hearing impairment and BMD. However, other study in Korean populations identified an association of low BMD with HL [10]. The inconsistencies in these previous studies suggest a need for additional research.
Various factors including age, sex, and postmenopausal status are associated with both hearing impairment and OP, and it is important to consider corrections for these potentially confounding factors when evaluating a potential association between HL and BMD. In addition, there may be differences in the baseline characteristics between study participants with diagnosed with OP and those without OP. Methods, such as multivariate or propensity score matched analyses, may be helpful in studies examining potential association between hearing impairment and OP. The objective of the present study was to examine the association between hearing impairment and OP in post-menopausal women, using appropriate statistical analyses.
MATERIALS AND METHODS
Study population
Data from the Korean National Health and Nutrition Examination Survey (KNHANES) 2010–2011 were used in statistical analyses. The KNHANES is a nationwide, multistage, stratified survey of a representative sample of the South Korean population conducted by the Korea Centers for Disease Control and Prevention. There were 17,476 participants in the KNHANES survey. The following categories of survey participants were excluded from the current study: males or premenopausal women (n=10,384); those without data regarding pure tone audiometry (n=2,325) or BMD (n=2,859); and those younger than 50 years old or older than 70 years old (n=426). In addition, KNHANES study participants diagnosed with external or middle ear disease (n=69), a history of brain disorders such as stroke (n=55), a history occupational or explosive noise exposure (n=261), or any subjects with asymmetric hearing results were excluded (n=88). This left a population of 1,009 KNHANES study participants who were included in the current study. Local ethical committee approval was obtained for this study (YUH-14-0512-085). Informed consent was waived since the subjects’ records and information were de-identified prior to the analysis.
Study variables
Clinical and laboratory data collected from participants during the health examination included age, body mass index (BMI, kg/m2), systolic blood pressure (SBP, mmHg), diastolic blood pressure (DBP, mmHg), fasting blood glucose (FBG, mg/dL), alkaline phosphatase (ALP, IU/L), intact parathyroid hormone (i-PTH, pg/mL), vitamin D (VitD, ng/mL), triglyceride (TG, mg/dL), and high density lipoprotein (HDL) cholesterol (mg/dL) levels, alcohol consumption, smoking behavior, exposure to noise, BMD (g/cm2), and hearing thresholds.
Whole body, dual-energy X-ray absorptiometry was performed with a QDR Discovery fan beam densitometer (Hologic Inc., Bedford, MA, USA) according to the manufacturer’s recommendations. All subjects wore light clothes, and removed all items, including jewelry, that could interfere with the measurement. BMD was measured at the femoral neck (FN) and lumbar spine (LS). The case definition of OP in this study was defined as T-score below –2.5 at the FN or LS in accordance with the World Health Organization (WHO) diagnostic classification [11].
FBG, ALP, TG, and HDL cholesterol levels were measured using an enzyme method (Hitachi Automatic Analyzer 7600, Hitachi, Tokyo, Japan). The i-PTH level was measured using a chemiluminescence immunoassay (LIASON, DiaSorin Inc., Stillwater, MN, USA). The VitD level was measured from 25-hydroxy VitD using a Radioimmunoassay (1470 WIZARD gamma-Counter, PerkinElmer, Turku, Finland). Blood pressure was measured three times by trained nurses using a mercury sphygmomanometer (Baumanometer, Baum, Copiague, NY, USA), with the participant in a seated position after a 5 minute resting period. The final blood pressure value was obtained by averaging the values of the second and third blood pressure measurements. The case definition of hypertension (HTN) was SBP ≥140 mmHg, DBP ≥90 mmHg, a self-reported history of HTN, or the use of antihypertensive drugs, and diabetes mellitus (DM) was defined a self-reported history of a DM diagnosis or a fasting glucose level of ≥126 mg/dL. Smoking behaviors were classified as current smoker, ex-smoker, or nonsmoker. Alcohol intake was defined by the Korean version of standard drinking, which was based on the WHO classification [12,13]. We classified alcohol intake into three categories: abstinence (not having had an alcoholic drink within the last year); moderate drinking (women, 0.1–19.99 g pure alcohol/day and men, 0.1–39.99 g pure alcohol/day); and heavy drinking (women, ≥20 g pure alcohol/day; men, ≥40 g pure alcohol/day).
Histories of exposure to explosives or occupational noise were classified as positive or negative, as previously described [14]. Briefly, an explosive noise was defined as a sudden loud noise such as an explosion or gunshot. Exposure to occupational noise was determined according to whether the participant had worked in a location with loud machinery for ≥3 months, where loud noise was defined by whether the participant had needed to raise his or her voice to have a conversation. Participants with these histories were excluded from the present study.
Participants’ hearing thresholds were measured using an automatic audiometer at 0.5, 1, 2, 3, 4, and 6 kHz. For both ears of each participant, the pure tone averages at 0.5 were averaged to obtain the low-frequency (Low-Freq) value; those at 1, 2, and 3 kHz, to obtain the mid-frequency (Mid-Freq) value; and those at 4 and 6 kHz, to obtain the high-frequency (High-Freq) value. In the present study, the average hearing threshold (AHT) was calculated as pure tone average at 4 frequencies (0.5, 1, 2, and 3 kHz). HL was defined as an AHT >25 dB.
Study cohort
We performed analyses using 2 cohorts. The total cohort was defined as all 1,009 participants. To balance the baseline characteristics between participants with and without OP, we estimated a propensity score, which is a predicted probability of OP in all participants using a logistic regression model constructed to include the variables of age, BMI, DM, HTN, ALP, and VitD. Using the Greedy match algorithm, we created a propensity score matched pair without replacement (1:1 match). We decided the weight order or priority according to standardized mean difference between the 2 groups. The standardized mean difference between participants with OP and those without OP in terms of age, BMI, ALP, DM, HTN, and VitD level was 0.687, 0.296, 0.204, 0.072, 0.062, and 0.047, respectively. Before the groups were matched, the propensity standardized mean difference was 0.755. After the groups were matched, the propensity standardized mean difference was 0.103. Although the standardized mean difference in terms of DM and HTN was rather low between the groups, these comorbidities are well-known risk factors for hearing impairment. The ALP and VitD levels may be associated with pathologic changes in BMD. Therefore, these factors were included as confounding factors. The propensity score matched (PSM) cohort was defined as the cohort including participants diagnosed with OP and participants without OP.
Statistical analyses
Data were analyzed using SAS ver. 9.4 (SAS Institute Inc., Cary, NC, USA). Categorical variables were expressed as numbers and percentages, and continuous variables were expressed as mean±SD or standard error. Either the Pearson chi-square test or the Fisher exact test was used to analyze categorical variables. For continuous variables, the t-test was used to compare the means. Within the PSM cohort, we compared the difference in variables between participants with OP and each matched participant with OP by using the paired t-test. Linear regression analysis was performed to assess independent predictors of hearing thresholds. Logistic regression analyses were used to estimate the odds ratios and 95% confidence intervals (CIs), which were used to determine the relationship between the OP and HL.
Three statistical models were developed where model 1 was unadjusted, model 2 included age, and model 3 included age, BMI, alcohol intake, smoking habit, DM, HTN, HDL cholesterol, TG level, VitD, and ALP. Multivariate analyses using analyses of covariance, multiple linear regression, or multiple logistic regression were used determine the independent predictors of HL. The level of statistical significance was set at a P-value of <0.05.
RESULTS
Clinical characteristics of the participants
There were 776 and 233 participants in the groups diagnosed without and with OP, respectively (Table 1). Age and ALP level were higher in participants diagnosed with OP when compared to participants without OP. In contrast, the BMI was lower in participants with OP than in those without OP. No significant differences in occurrence of DM, HTN, or i-PTH, VitD, HDL cholesterol, or TG levels, alcohol intake, or smoking behavior were observed between the 2 groups.
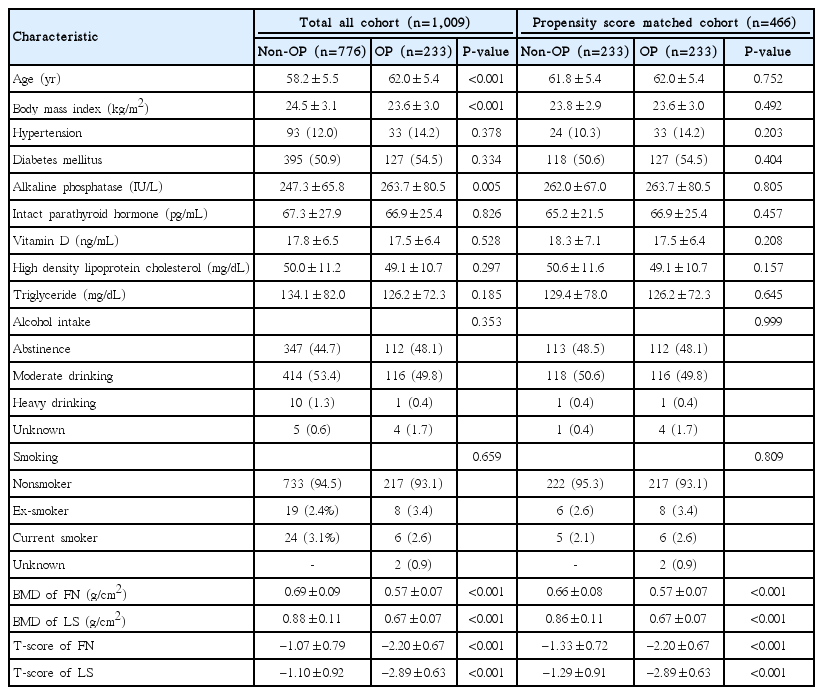
Baseline characteristics of the participants according to the absence or presence of osteoporosis
For propensity score matching, 233 pairs were selected from the 776 participants without OP. The estimated distribution of propensity scores was similar after matching, and no significant differences were identified in characteristics corresponding to the presence or absence of OP (Table 1, Fig. 1). In addition, we compared the difference between participants with OP and each matched participant without OP. Mean difference±SD was 0.16±4.65 for age (P=0.603), 0.19±3.69 for BMI (P=0.438), 1.70±98.57 for ALP level (P=0.793), 0.79±9.15 for VitD level (P=0.188), and 1.63±33.29 for i-PTH level (P=0.456). The participants with OP did not significantly differ from each matched participant without OP in terms of age, BMI, ALP, VitD, and i-PTH levels.

Distribution of propensity score before and after matching. (A) Before matching OP, (B) after matching OP, (C) before matching non-OP, and (D) after matching non-OP. OP, osteoporosis; non-OP, without osteoporosis.
Comparison of hearing loss between participants with and without OP
In the total cohort when using statistical model 1, the Low-Freq, Mid-Freq, High-Freq thresholds, and the AHT were higher in the participant group with OP than in participants without OP (Table 2). However, using statistical models 2 and 3, no significant difference in the four hearing thresholds was identified between the 2 groups. In the PSM cohort, the Low-Freq hearing threshold in the groups without OP and that with OP was 20.0±10.4 and 20.2±10.9 dB (P=0.795), respectively; Mid-Freq hearing threshold was 21.8±11.0 and 21.6±12.0 dB (P=0.896), respectively; High-Freq hearing threshold was 35.1±15.1 and 35.7±15.8 dB (P=0.686), respectively; and AHT was 21.3±10.2 and 21.3±11.2 dB (P=0.968), respectively. In the PSM cohort, statistical model 1 also yielded similar results (Fig. 2).
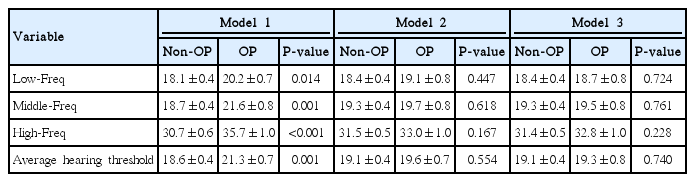
Hearing thresholds according to the absence or presence of osteoporosis
Comparison of hearing thresholds between groups without OP and with OP in the propensity score matched cohort. The data are expressed as mean and standard deviation values. OP, osteoporosis; non-OP, without osteoporosis; Freq, frequency; AHT, average hearing threshold.
In the total cohort, the proportion of participants with HL in the group without and with OP was 20.4% and 30.9%, respectively (P=0.001). Logistic regression indicated that, in model 1, participants with OP had a 1.749 increased risk for HL (95% confidence interval [CI], 1.260 to 2.429; P=0.001) when compared to participants without OP. However, those with OP had a 1.164 (95% CI, 0.818 to 1.656; P=0.398) and 1.128 (95% CI, 0.835 to 1.724; P=0.323) increased risk in models 2 and 3, respectively. A significant HL risk was not observed in participants with OP.
In the PSM cohort, the proportion of participants with HL in the groups without and with OP was 30.5% and 30.9%, respectively (P=0.920). Logistic regression using statistical model 1 indicated that participants with OP had a 1.020 (95% CI, 0.688 to 1.513; P=0.920) increased risk when compared to the participants without OP.
Association of hearing thresholds with BMD
In the total cohort, using statistical model 1, LS and FN T-scores were inversely associated with changes in the Low-Freq, Mid-Freq, High-Freq thresholds, and the AHT. However, using statistical model 2, LS T-score was inversely associated only with changes in the Low-Freq threshold (Table 3). Using statistical model 3, there were no significant associations among LS or FN T-scores and changes in the four hearing thresholds.

Association of hearing thresholds with bone mineral density
In the PSM cohort, the LS T-score was inversely associated with changes in the Low-Freq threshold, and the FN T-score was inversely associated with changes in the Low-Freq, Mid-Freq thresholds, and AHT. Using statistical model 2 with the PSM cohort, LS and FN T-scores were only associated with changes in the Low-Freq threshold. In contrast, using statistical model 3 with this cohort, no significant associations among LS or FN T-scores and changes in the four hearing thresholds were identified.
DISCUSSION
The results of the current study did not find an association between BMD, or OP and changes in hearing thresholds, analyzed as a continuous variable, or HL, analyzed as a categorical variable. Neither multivariate analyses adjusted for potential confounders, nor analyses using the PSM cohort to match baseline characteristics, demonstrated an association between the study variables. Therefore, the results of the current study indicate that BMD is not associated with hearing impairment in the Korean post-menopausal population.
Previous studies have evaluated a potential association between BMD and HL in patients with pathologic bone disorders such as otosclerosis or Paget’s disease [15-18]. Although there are differences in pathophysiology between OP and pathologic bone disorders, some pathologic findings appear to be shared. Demineralization of the otic capsule or cochlea has been associated with secondary neuronal degeneration, which consequently results in sensorineural HL [19,20].
In contrast to the results from the aforementioned studies in patients diagnosed Paget disease, other epidemiologic studies have shown conflicting results regarding an association between HL and BMD in patients without Paget’s disease or otosclerosis [4-10]. A study by Helzner et al. [5,6] enrolled both African American and Caucasian study populations and evaluated the possibility of an association between HL and BMD. The study demonstrated that HL is only associated with BMD in African American men, and not in African American women or the Caucasian study population [5,6]. However, another study using participants from multiple ethnic groups did not demonstrate any differences in hearing impairment among ethnic groups [8]. The mechanism for association of HL and BMD in different ethnic groups is not well understood, but may be associated with different amounts of melanin, which has been hypothesized to have a protective effect [21]. Further investigation will be needed to clarify the presence or absence of an association between BMD and HL in different ethnic group.
The Korean population may be considered to be midway between Caucasian and African American populations in terms of ethnic group classifications. Two previous studies evaluated the possibility of an association between BMD and HL in the Korean population. One study did not demonstrated an association between the 2 variables [4], while the second study did show an association between BMD and HL [10]. The population in the previous study, which exhibited negative results, enrolled a total 1,830 postmenopausal Korean women [4]. In the negative study, multivariate analysis adjusted for age, serum estradiol, and hormone replacement therapy failed to demonstrate an association between BMD and HL, while the other study showed a positive association between HL and LS-BMD [10]. The study with a positive association enrolled only 324 participants, and a multivariate analysis was performed with adjustments for age, BMD, VitD, and serum calcium. In addition, the statistical significance of the multivariate analysis was modest (P=0.047). It is possible that adjustment for additional potentially confounding factors such as DM or HTN could cause there to be no statistically significant differences in the data in their study.
In comparison with these two previous Korean studies, the multivariate analyses in the current study were adjusted to account for various potentially confounding factors such as DM, HTN, VitD, and i-PTH. Additionally, we analyzed using 2 cohorts including both a total study population, and a PSM cohort. The PSM cohort consisted of pairs of study participants matched for baseline characteristics including age, BMI, VitD, i-PTH, DM, HTN, and ALP. It is possible that these factors may be different between groups with and without OP, which may ultimately influence HL. In the current study, we first analyzed the total cohort. Univariate analysis showed a positive association between BMD and HL, but multivariate analysis adjusted for potentially confounding factors showed a negative association. In the second PSM cohort where participant baseline characteristics were matched, there also were no significant differences in the proportion of HL and hearing thresholds between groups with and without OP.
There are several limitations in the present study. First, the study was limited by its cross-sectional nature, and therefore this study could not establish causality. Second, this study did not evaluate data regarding conductive HL or the more sensitive components of hearing impairment, including speech discrimination. Finally, selection bias may have been present due to the exclusion of 5,184 participants without audiometric or BMD data, who comprised approximately 29.7% of the total KNHANES population.
In conclusion, the current study did not demonstrate and association between BMD and hearing impairment in the study population of postmenopausal Korean women. Further prospective analysis, including follow-up data, analysis of speech discrimination, and a larger study participant population, will be needed to continuous to examine whether there is an association between BMD and HL in these populations.
HIGHLIGHTS
▪ Seven hundred seventy six and 233 participants in the groups diagnosed without and with osteoporosis (OP) were examined hearing results.
▪ In the total cohort, the proportion of participants with hearing loss in the group without and with OP was 20.4% and 30.9%, respectively (P=0.001).
▪ In the propensity score matched (PSM) cohort, adjusted model for risk factor, no significant associations among lumbar spine or femoral neck T-scores and changes in the hearing thresholds.
▪ This study did not demonstrate the association between bone mineral density and hearing impairment in the study population of postmenopausal Korean women.
Notes
No potential conflict of interest relevant to this article was reported.
Acknowledgements
This research was supported by Basic Science Research Program through the National Research Foundation of Korea (NRF) funded By the Ministry of Science, ICT & Future Planning (2014R1A1A3049993).