


INTRODUCTION
Superior semicircular canal dehiscence (SSCD) is an audiovestibular pathology first described in 1998 by Minor et al. [1]. The SSC develops a defect in the bony roof that forms a ŌĆ£third moving windowŌĆØ in the bony labyrinth. This allows the endolymph to move under the influence of loud noise or pressure, triggering vestibular symptoms such as dizziness, nystagmus, and oscillopsia [2] and cochlear findings such as conductive hearing loss, autophonia, bone conduction hyperacusis, tinnitus, and ear fullness [3]. However, as these symptoms are not specific to SSCD, they cannot be used alone for diagnosis. High-resolution computed tomography (HRCT) is useful, as are audiological tests such as tympanometry, acoustic reflex evaluation, and audiography. In addition, the cervical vestibular-evoked myogenic potential (cVEMP) test is employed for screening. However, the need for high-level patient compliance and various factors associated with standardization limit the use of cVEMP for diagnostic purposes [4,5].
The tympanometer is a noninvasive immitansmetric instrument assessing sound transmission in the middle ear. The resistance or permeability of the middle ear to a sound at constant frequency (226 Hz) is assessed by changing the pressure in the external auditory canal [6]. The wideband tympanometer allows immitansmetric measurements over a wide frequency range (226 to 8,000 Hz) by changing the pressure of both the ambient and external auditory canals. The wideband acoustic absorbance measured reflects sound energy absorbed by the middle ear, whereas the wideband acoustic reflectance is the reflected sound energy. These two measurements are inversely proportional and sum to unity. The wideband acoustic reflectance values are highest below 1,000 Hz and above 4,000 Hz [7]. Thus, the absorbance ratios are highest in these frequency ranges. The maximum absorbance frequency (MAF) of wideband tympanometry (WBT) lies in t his range under normal conditions. Another parameter evaluated is the resonance frequency (RF), which is the frequency at which the mass and stiffness effects of the middle ear are equal. The middle ear transmits sound at the RF more readily than sounds at other frequencies [8]. WBT data are thus quite different from those obtained via tympanometry, affording extensive insight into the middle and inner ears, and facilitating identification of various pathologies. However, WBT is relatively new; few normative data are available [9,10]. WBT data from patients with various ear diseases/pathologies are scarce. The primary aim of this study was to explore whether WBT could serve as a simple, noninvasive screening test for SSCD. Our secondary aim was to derive WBT data on SSCD patients.
MATERIALS AND METHODS
Participants
Our local Ethics Committee approved this study (No. 2018/45). All participants provided written informed consent. We radiologically assessed and clinically diagnosed SSCD patients (the SSCD group) treated in the Otorhinolaryngology Department of Recep Tayyip Erdogan University Faculty of Medicine, Rize, Turkey between 2013 and 2018, as well as healthy volunteers (the normal group). The inclusion criteria for the normal group were a normal otological examination; no otorhinolaryngological surgical history; and no cochleovestibular complaint such as hearing loss, tinnitus, or vertigo. The pure tone audiometry, tympanometry, and acoustic reflex test data were all normal. The inclusion criteria for the SSCD group were a radiological diagnosis of SSCD, a normal otological examination, no otorhinolaryngological surgical history, normal tympanometry, pure tone audiometry, and acoustic reflex test results, and a threshold reduction on the SSCD side on cVEMP testing.
Radiological evaluation
SSCD was radiologically diagnosed via HRCT, performed in our hospital at a slice thickness of 0.75 mm (128 slices) (SOMATOM; Siemens, Munich, Germany). The operating parameters were 120 kV, 220 mA, and 186├Ś186-pixel field-of-view. Alternatively, the slice thickness was 0.625 mm (256 slices) (Discovery CT750 HD; General Electric, Boston, MA, USA) with operating parameters of 140 kV, 150 mA, and 190├Ś186-pixel field of view. Multiplanar reformatted images were obtained using a workstation running Syngo software (ver. VA20; Siemens Healthcare, Forchheim, Germany). SSCD was detected by vertical angling in the coronal plane that was perpendicular to the petrosal bone and parallel to the SSCD (the P├Čschl plan); and parallel to the petrosal bone and perpendicular to the SSCD (the Stenvers plan). All radiological evaluations were performed by two radiologists (FBC, MFI) with experience in head-and-neck imaging, blinded to both the affected side and the clinical findings. Loss of integrity of the bony roof surrounding the SSC was considered to reflect dehiscence.
Audiological assessment
The cVEMP test was performed with the aid of an Eclipse VEMP device (Interacoustics, Assens, Denmark). The test featured a 500-Hz tone-burst stimulus. The initial stimulus was 95 dB, which was lowered until a 10-dB response was obtained. If no response was obtained, the threshold was determined via stepwise (5 dB) increases [11]. A cVEMP value <80 dN nHL was used to diagnose SSCD.
The tympanometer was employed in conjunction with an acoustic reflex tester (AT235H device, Interacoustics) operating at a frequency of 226 Hz. Type A patients (using the Jerger calcification) were considered normal [12]. All tympanometry and acoustic reflex data were normal for all individuals in both groups. Pure tone audiometry tests were performed using an AC40 device (Interacoustics). Pure tone averages were obtained at 500, 1,000, 2,000, and 4,000 Hz. The air and bone pathway thresholds of all subjects were normal (Ōēż30 dB). SSCD patients may exhibit conductive hearing loss on pure tone audiometry testing [13]. Bone conduction hyperacusis is another possible symptom of SSCD. The combined increase in bone conduction hyperacusis and the air conduction threshold creates an air-bone gap (ABG). Thus, we extended the start point for evaluation of bone conduction to ŌĆō20 dB nHL. In patients with SSCD, WBT test results may be affected by the ABG and bone conduction hyperacusis occurring at low frequencies. For this reason, patients with ABGs, i.e., those exhibiting conductive hearing loss or hyperacusis, were excluded.
WBT was performed using the Titan device (Interacoustics). Measurements were made at 0 pressure (da Pa) using a 90┬▒3 dB sound stimulus. We recorded the RF, maximum absorbance ratio (MAR), and MAF. OtoAccess software (ver. 1.2.1, Interacoustics) was used to analyze the data.
Statistical analyses
Statistical analyses were performed using IBM SPSS ver. 20.0 (IBM Corp., Armonk, NY, USA). The RF, MAR, and MAF values of the normal and SSCD groups were compared using the t-test. The statistical significance level was set to P<0.05. In addition, receiver operating characteristic (ROC) analyses were performed to derive cutoff values for all data in terms of SSCD diagnosis. We explored whether the data could be used for screening based on specificity and sensitivity.
RESULTS
In the normal group, we included 47 ears (right, 22; left, 25) of 27 subjects (14 females, 13 males; average age, 39.7 years; range, 20 to 64 years). Seventeen SSCD patients (four with bilateral disease) were included; we studied 21 ears (right, 9; left, 12) of seven females and 10 males with an average age of 39.6 years (range, 21 to 63 years) (Table 1).
The reasons for polyclinic admission included voice-induced vertigo (the Tullio phenomenon, n=5), pressure-induced vertigo (Hennebert sign, n=2), dizziness-like vertigo (n=8; accompanied by tinnitus in two cases), and acute-onset vertigo (n=2). Benign paroxysmal positional vertigo was ruled out in all patients, especially those with acute-onset vertigo. All otological pathologies that may cause vertigo were also ruled out based on history-taking and physical examination. Detailed neurological examinations were performed and biochemical tests conducted. Patients with pathologies that might trigger vertigo were excluded.
The mean RF was 935.1 Hz (range, 239 to 1,875 Hz) in the normal and 548.7 Hz (range, 243 to 853 Hz) in the SSCD group; the difference was significant (P<0.001). The mean MAR was 82.4% (range, 63% to 99%) in the normal group and 89.4% (range, 62% to 100%) in the SSCD group; the difference was significant (P=0.005). The mean MAF was 2,668 Hz (range, 876 to 4,387 Hz) in the normal group and 1,706.3 Hz (range, 613 to 3,816 Hz) in the SSCD group; the difference was significant (P<0.001) (Table 2).
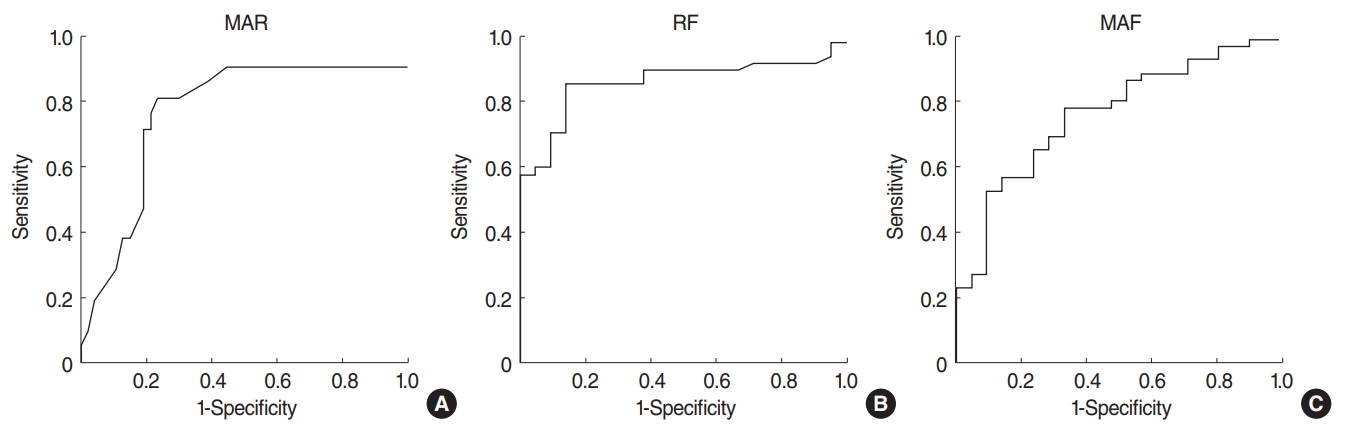
All three datasets were subjected to ROC analysis. In terms of SSCD diagnosis, a MAR above 86% (area under the curve [AUC], 0.77┬▒0.07; 95% confidence interval [CI], 0.63 to 0.90) afforded 81% sensitivity and 77% specificity; an RF below 728 Hz (AUC, 0.86┬▒0.05; 95% CI, 0.76 to 0.95) 86% sensitivity and 81% specificity, and an MAF below 1,835 Hz (AUC, 0.77┬▒0.06; 95% CI, 0.65 to 0.89) 79% sensitivity and 67% specificity (Fig. 1). As the AUCs were all 0.5ŌĆō1, and the safety intervals were very high, all three parameters can be used for diagnostic screening. Data on all participants are detailed in Tables 3 and 4.
DISCUSSION
HRCT can confirm a diagnosis of SSCD [14]. However, the radiological prevalence of SSCD is very variable, more so than on histopathological testing. In addition, most patients with radiological diagnoses are asymptomatic. Clinical findings are evident in only about one of every three patients with dehiscence, perhaps because SSC bone thinning to less than 0.1 mm is required before dehiscence is recognized. Thus, diagnosis requires both clinical and radiological assessments [15,16]. HRCT should be performed after suspect patients first undergo clinical tests; screening tests with high diagnostic utility are needed.
cVEMP tests performed at low frequencies (250 and 500 Hz) can be used for clinical screening [11]. However, the cVEMP test has several limitations, including a lack of consensus in terms of the SSCD diagnostic threshold, lack of standardization, the fact that patients with cervical disease find it difficult or impossible to perform the test, individual differences in muscle activity and mass, difficulties in calculating these values, and decreases in VEMP responses with age [5,17,18]. We found no literature on the cVEMP threshold for SSCD diagnosis. However, in general, the response thresholds of our patients were below 80 dB [11,15,19]. Thus, we set the cVEMP limit to 80 dB.
When HRCT is used to diagnose SSCD, the margin of error may be high because of the absence of clinical correlations. Furthermore, if used as a screening test, HRCT is relatively costly and carries the risks associated with ionizing radiation. The cVEMP test has several limitations. Therefore, screening tests that are inexpensive, reliable, and simple are required.
A missed SSCD diagnosis may delay appropriate treatment, both of SSCD per se and of other underlying diseases (e.g., Meniere disease, otosclerosis, and/or eustachian tube dysfunction) [13]. However, it should not be forgotten that an incorrect SSCD diagnosis may trigger unnecessary exploratory tympanotomies and unsuccessful stapedectomies [20]. Therefore, screening tests should be used to confirm the diagnosis, thus addressing underlying diseases in patients suspected as having SSCD and radiological bone defects.
Although some normative WBT data are available, variations by age, sex, ear side, medical device used, and ethnicity are considerable [7,9,21]. Thus, we designed our study by reference to earlier work done in our clinic and derived normative WBT data for the Turkish population [10]. The present study was conducted in the same ethnic group, using the same device. Our results were not affected by ear side or sex. In terms of age group, only the RF of subjects aged 0ŌĆō1 months differed from those of subjects aged 2 months to 20 years; the MARs and MAFs did not differ [10]. Subjects aged below 20 years differed from older subjects in these parameters, but all subjects aged over 20 years were similar. Therefore, there was no need to group patients by age.
WBT is used to evaluate sound transmission from the middle to the inner ear, and sound reflection from the middle ear over a wide frequency range (principally 1,000ŌĆō4,000 Hz). Middle ear conductance is optimal in this band, as is inner ear sensitivity [7,22]. In other words, the RF, MAF, and MAR values yielded by WBT reflect the condition of both the middle and inner ear. WBT yields information on both middle and inner ear diseases. Thus, we evaluated WBT data from patients radiologically and clinically diagnosed with SSCD.
We found that the RF was significantly lower in SSCD patients than in normal subjects. Sato et al. [22] performed multifrequency tympanometry and obtained RF scans of patients with large vestibular aqueducts (LVAs). The RFs of LVA patients were lower than those of the normal population. Taking our work into consideration, we suggest that the symptoms of both LVA and SSCD are attributable to the third windows created by both diseases. We also found that the MAFs of SSCD patients were significantly lower than those of healthy subjects. In SSCD patients, the inner ear responds better to low frequencies, perhaps because the vibrational effects of such frequencies expand the inner ear fluid (which is particularly susceptible to vibration), in line with the fact that the cVEMP test threshold was low. In addition, SSCD patients had higher MARs than normal individuals. The RFs and MAFs were both lower in SSCD patients than healthy individuals; the MARs increased in patients with SSCD. We suggest that these findings reflect the enhanced inner ear sensitivity of SSCD. We thus suggest that WBT may be a good alternative to the cVEMP test for SSCD screening. WBT is better than the cVEMP test in terms of procedural ease, reduced need for patient compliance, and lower dependency on personal factors such as age, weight, and muscle mass.
We also obtained WBT data on SSCD patients. However, at present it is not possible to compare our results to those obtained from patients with other middle and inner ear pathologies. WBT is relatively new, such that additional normative data are required. However, RFs can be expected to be higher, and inner ear absorbances to decrease, in those with pathologies increasing ear hardness, such as otosclerosis and tympanosclerosis. Voice conduction to the inner ear becomes more difficult if the ossicular chain is fractured. Thus, in terms of the middle ear space, the data would be expected to be the opposite to those of SSCD. WBT data in patients with various middle and inner ear pathologies should be compared in future.
Our principal aim in this study was to assess whether WBT could be used as a screening test for SSCD. We found significant differences between the WBT data of SSCD patients and healthy individuals, suggesting that WBT might be a useful clinical screening test. ROC analysis showed that a MAR over 86%, and an RF and MAF below 728 and 1,835 Hz, respectively, served as appropriate cut-off values for SSCD diagnosis.
Our study had certain limitations. A definitive diagnosis of SSCD is made during surgery, via a mid-fossa approach, when a bone defect is found in the SSC. We informed all SSCD-suspect patients of this, in terms of both diagnosis and treatment. However, the patients refused surgery because of the possible risks. The principal limitation of our study is that it lacked surgical diagnoses. However, all radiological evaluations were performed in a double-blinded manner by two radiologists experienced in head-and-neck thin-section HRCT, and we also included patients with cVEMP values below 80 dB; we thus suggest that our study is of high clinical quality. Moreover, the fact that inner ear sensitivity was elevated on WBT testing supports this suggestion. A second limitation is that the number of patients was low, although our findings were statistically significant. Standardized SSCD diagnostic criteria must be derived using larger patient series, in multi-center studies if necessary. Third, dehiscence diameters should be categorized and associated with WBT data in larger patient series. Does the dehiscence diameter affect the WBT results, and if so, how?
Our results suggest that WBT can serve as a noninvasive, inexpensive, and simple screen for SSCD. The MAR is higher, and the RF and MAF lower, in SSCD patients than in healthy individuals. The data support the idea that inner ear sensitivity is increased in SSCD patients; the inner ear is less resistant to sound.
HIGHLIGHTS
Ō¢¬ Wideband tympanometry could be used as a noninvasive, inexpensive and easy screening test for superior semicircular canal dehiscence.
Ō¢¬ Inner ear absorbance ratio increased in patient with superior semicircular canal dehiscence.
Ō¢¬ Resonance frequency is obtained at lower frequencies in patient with superior semicircular canal dehiscence.