Abrupt Change in Electrophysiological Properties Begins From Postnatal Day 7 Before Hearing Onset in the Developing Mice Auditory Cortical Layer II/III Neurons
Article information

Abstract
Objectives
In the developing auditory cortex, maturation of electrophysiological properties and cell types before and after hearing onset has been reported previously. However, the exact timing of firing pattern change has not been reported. In this study, firing pattern change was investigated from postnatal day 3 (P3) to P12 in auditory cortical layer II/III neurons to investigate whether firing pattern changes dramatically after a specific point during development.
Methods
ICR mice pups aged from P3 to P12 were sacrificed to obtain 300-mm-thick brain slices containing the primary auditory cortex. From cortical layer II/III neurons, the patterns of action potential firing generated by current injection were examined using whole cell current clamp technique and the characteristics of Na+ currents involved in action potential firing were investigated using whole cell voltage clamp technique.
Results
From P3 to P6, most cells did not show action potential firing (29 of 46 cells), and some cells responding to current injection showed a single action potential at the initial depolarizing current step (17 of 46 cells). This firing pattern changes from P7. From P7 to P9, cells begin to show regular spiking to current injection. The spiking frequency increased after P10. In studying Na+ current with whole cell voltage clamp, Na+ current densities increased gradually (32.0±2.0 pA/pF [P3–P6, n=7], 51.2±2.0 pA/pF [P7–P9, n=13], and 69.5±3.7 pA/pF [P10–P12, n=13]) in low external [Na+] condition. Na+ current recovery was accelerated and inactivation curves shifted to hyperpolarization with age.
Conclusion
As regular spiking cells were observed from P7 but never from P3 to P6, P7 might be regarded as an important milestone in the development of auditory cortical layer II/III neurons. This change might mainly result from the increase in Na+ current density.
INTRODUCTION
There are some milestones in the development of the rodent auditory cortex. The most important one is the one associated with audition. The auditory experience begins between postnatal day 10 (P10) and P14 [1], and it accelerates the functional development of the auditory cortex [2,3]. Cortical evoked potentials first occur from P10 to P13. Their properties (amplitude, latency, and complexity) change rapidly during the 3rd week and then mature fully at a slower rate over several weeks [4,5]. For this development to occur, thalamocortical connections have to be established before hearing onset. The arrival of thalamocortical afferents in layer IV of the sensory cortex in rodents is reported to be around P3–P4 [6]. Therefore, the development of the auditory cortex can be divided into three periods, which are the period: (1) before the arrival of thalamic afferents, (2) between hearing onset and thalamic afferent arrival, and (3) after hearing onset.
The second period stated above is approximately from P5 to P9. During this period, many important changes occur in the rodent brainstem auditory circuits. The decline in glutamate release from the GABAergic/glycinergic/glutamatergic medial nucleus of the trapezoid body (MNTB)—lateral superior olive (LSO) synapses [7], functional elimination of MNTB-LSO connections with a topographic sharpening of the MNTB [8], change in subunit composition in the developing glycine receptor [9], and a depolarizing to hyperpolarizing shift in the superior olivary complex nuclei [10] are some examples of these changes. These altered synaptic activity from the brainstem might influence the developmental connectivity of the auditory cortical circuit before hearing onset because input connections from auditory brainstem nuclei to the inferior colliculus [11] and thalamocortical afferents to layer IV of the sensory cortex [6] are already established.
In the auditory cortex, responses to acoustic stimuli vary according to neuronal types. Some respond transiently, falling silent after one or a few spikes [12] while others respond in a sustained manner [13,14], and these responses are closely related to neuronal types. In developing auditory cortical layer II/III neurons, neuronal types and intrinsic electrophysiological properties such as the action potential firing pattern, resting membrane potential, and input resistance were extensively studied during the period between P8 and P29 [15,16]. However, the changes in electrophysiological properties during P3–P9 in auditory cortex layer II/III neurons have not been reported yet. Therefore, in this study, the targeted period was limited to the period between P3 and P12 and I investigated whether the period between P7 and P9, when profound changes occur in brainstem auditory circuits, might be an important transitional period in the development of cortical layer II/III neurons. Electrophysiological properties of neurons in layers II/III were examined using whole cell voltage or current clamp as these neurons are the main recipients of lemniscal thalamocortical projections [17] and have been well described in previous studies [15,16].
MATERIALS AND METHODS
ICR mice pups (P3–P12) of either sex were used. This study was approved by the Dankook University Institutional Animal Care and Use Committee. Auditory thalamocortical slices were prepared as described previously [18]. Mice were anesthetized with isoflurane and decapitated. The brain was exposed and the cerebellum was removed by a coronal cut. The brain was then immersed, posterior cut down, in ice-cold oxygenated (95% O2–5% CO2) sucrose rich solution (composition: sucrose, 206 mM; MgCl2, 10 mM; glucose, 11 mM; NaH2PO4, 1.25 mM; NaHCO3, 26 mM; CaCl2, 0.5 mM; KCl, 2.5 mM). A second cut was made with an approximately 15° medial-to-lateral inclination to remove the dorsal portion of the brain. The dorsal surface of the brain was then glued onto the vibratome stage. The brain was quickly reimmersed in ice-cold sucrose rich solution and horizontal slices (300 μm) were made. As the lateral geniculate nucleus and the fimbria became visible, slices were examined under a dissecting microscope and a selected slice was placed in the recording chamber filled with artificial cerebrospinal fluid (composition: NaCl, 124 mM; KCl, 5 mM; KH2PO4, 1.25 mM; glucose, 10 mM; NaHCO3, 26 mM; CaCl2, 2 mM; MgSO4, 1.3 mM) at room temperature. One or two slices that contained the primary auditory cortex, medial geniculate nucleus, and lateral geniculate nucleus were obtained.
Electrophysiological recording
Membrane responses were studied under voltage or current clamp at room temperature using the whole cell patch clamp technique with the Axopatch 1D amplifier (Axon Instruments, Foster City, CA, USA). Data acquisition was performed using Clampex 9.2 software (Axon Instruments) and a Digidata 1220 (Axon Instruments) data acquisition board. Data were filtered at 5 kHz, digitized at 10 kHz, and stored on a computer. Offline data analysis was performed using Clampfit 10.3 (Axon Instruments) and Prism software (GraphPad Software, San Diego, CA, USA).
For whole cell recordings, two internal solutions were used (a K-based solution for current clamp and a Cesium [Cs]-based solution for voltage clamp): (1) K-based internal solution (composition: K-gluconate, 130 mM; EGTA, 1 mM; KCl, 4 mM; HEPES, 20 mM; Na2GTP, 0.3 mM; K2ATP, 1 mM; sucrose, 10 mM; titrated with KOH), and (2) Cs-based solution (composition: Cs-methanesulfonate, 140 mM; EGTA, 0.1 mM; HEPES, 20 mM; MgATP, 1 mM; Na2GTP, 1 mM; sucrose, 10 mM; TEA-Cl, 10 mM; titrated with CsOH). Patch pipettes were pulled from soda glass capillaries (Harvard Apparatus, Edenbridge, UK) and electrode resistances were 4–5 MΩ. Series resistance was typically less than 15 MΩ and was fully compensated. Capacitance cancellation was performed by adjusting whole cell capacitance knob of Axopatch 1D amplifier. Membrane potentials were corrected for a liquid junction potential (11.2 [K-based solution]–11.3 mV [Cs-based solution]), calculated with the Clampex 10.3 software (Axon Instruments).
In whole cell current clamp experiments, membrane voltage responses elicited by current injection were recorded using K-based internal solution. Rectangular current pulses were injected directly on cells through recording electrode from –200 pA to 350 pA with increments of 50 pA. Input resistance (input resistance=voltage/current) was calculated from linear regression using recorded voltage responses to injected currents.
In whole cell voltage clamp experiments investigating current-voltage relation, depolarizing voltage steps were given from –66.3 mv to 13.9 mV with 10 mV increment (holding potential –71.3 mV). To minimize the involvement of surface membrane area, current density (current amplitude/capacitance) was used to show the current-voltage relation. Cell capacitance was measured reading whole cell capacitance knob of Axopatch 1D.
In whole cell voltage clamp experiments investigating steady state inactivation, a conventional two pulse protocol was used. Inactivation curves were obtained by measuring the peak currents recorded at a potential of –31.3 mV after conditioning pulses (1 second) from the holding potential of –71.3 mV. The conditioning pulses were from –111.3 mV to more depolarized voltage levels with 2 mV increments. Normalized peak currents were plotted against the different conditioning potentials and fitted by a modified first-order Boltzmann equation: y=A2+(A1–A2)/{1+exp(V–Vhalf/S)}, where y is the normalized peak current, A2 is the minimal normalized peak current, A1 is the maximal normalized peak current, V is the commanding potential, Vhalf is the potential of half-maximal inactivation, and S (slope factor) is the voltage sensitivity of inactivation. To avoid space clamp error, only the results showing peak currents within 2 milliseconds were analyzed.
In whole cell voltage clamp experiments investigating Na+ current recovery, a conventional double-pulse protocol was used, in which the time between two consecutive depolarizing pulses is gradually increased. The relative current (peak current of the second current/peak current of the first current) was plotted as a function of the interpulse interval and a single exponential function (y=y0+A·exp(–χ/τ)) was fitted to the data.
Data were expressed as the mean±standard error of mean. Analysis of variance with post-hoc analysis was used for comparisons. Null hypotheses of no difference were rejected if P-values were <0.05.
RESULTS
Current clamp response based cell categorization
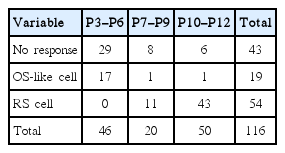
Whole cell current clamp recordings were made from 116 P3–P12 neurons in LII/III of the primary auditory cortex. Many neurons (46 out of 116 cells) were unable to generate action potentials after depolarizing current injection in P3–P12 cells (data not shown). Those cells were excluded from the analysis due to the possibility of cell injury during slice preparation or patching procedure. Based on spike number, P3–P12 neurons were divided into two types, regular spiking (RS) and on-spiking (OS)-like cells. These cells were described in other reports [15]. OS-like cells were mainly observed among P3–P6 cells (17 out of 46 cells). Twenty-nine cells did not generate action potentials following current injections. RS cells were the most common cell types after P7 (54 out of 70 cells). Only two OS-like cells were observed after P7 and 14 cells did not generate action potentials. Among P7–P9 cells, one OS-like cell, 11 RS cells and eight no action potential generating cells were observed, while there were one OS-like cell, six no action potential generating cells and 43 RS cells among P10–P12 cells. The cell responses are summarized in Table 1.
Cell classification
RS cells were further subdivided into two groups (P7–P9 and P10–P12) according to their input resistances and action potential numbers. Input resistances were estimated from the late voltage responses generated by hyperpolarizing current pulses (Fig. 1A-G). The mean input resistances of three groups were 587.5±30 MΩ (P3–P6, n=17), 344.6±12 MΩ (P7–P9, n=11), and 177.5±7 MΩ (P10–P12, n=43) (Fig. 1G). They were significantly different (P<0.001). The action potential numbers generated by depolarizing current pulses were also different between P7–P9 and P10–P12 mice. While the number of action potentials were maintained by injecting currents ranging from 50 pA to 250 pA with the maximal responses at 100 pA or 150 pA in P10–P12 mice, the number of action potentials decreased abruptly in P7–P9 mice with the maximal response at 50 pA (Fig. 1H). In 43 P10–P12 neurons, the number of action potentials was 5.3±0.2 (50 pA), 7.8±0.3 (100 pA), 7.8±0.5 (150 pA), 6.4±0.7 (200 pA), and 5.4±0.8 (250 pA) and in 11 P7–P9 neurons, the number of action potentials was 6.8±0.2 (50 pA), 6.5±0.7 (100 pA), 3.2±0.6 (150 pA), 1.9±0.1 (200 pA), and 1.8±0.1 (250 pA) (Fig. 1H). The resting membrane potentials were also different (P<0.001). The resting membrane potential was measured immediately after whole cell configuration was established. The resting membrane potentials obtained from all the cells recorded were –50.6±1.3 mV (P3–P6, n=42), –56.3±0.8 mV (P7–P9, n=20), and –63.0±0.7 mV (P10–P12, n=50) (Fig. 1I). These resting membrane potentials are similar to those reported in other areas of the brain [19-21].
Intrinsic neuronal properties from P4 (A), P8 (B), and P11 (C) mice. The current protocol is shown above figures. Filled squares below figures (A-C) indicate voltage measuring points for the current-voltage relationship in (D-F). Current-voltage relations in neurons of different ages are shown in (D-F: P3–P6 [D], P7–P9 [E], P10–P12 [F]). Fitting lines obtained from linear regression are drawn over the mean values. A graph of input resistances against age is shown in (G). Asterisks over columns indicate the statistical significance. (H) The relation between the number of spikes and injected currents is shown. (I) A graph of resting membrane potential against age is shown. P, postnatal day.
Characteristics of sodium current
Given that sodium channels play essential roles in the generation of action potentials, the possibility that properties of Na+ currents might be different among three periods was investigated using whole-cell voltage clamp technique. The problem with recording Na+ current is the loss of voltage control due to series resistance and space clamp errors as peak Na+ currents become larger with development. This loss of control is characterized by a lack of graded responses to voltage steps, which is related to series resistance errors, and a delayed onset to peak current, which is related to space clamp errors [22]. A typical example showing a delayed response is shown in Fig. 2D. To improve voltage control, the size of the Na+ current should be reduced. For that purpose, external [Na+] was reduced from 150 mM to 88 mM. The reduced Na+ was replaced by an equimolar concentration of N-methyl-glucamine chloride (NMG-Cl). Typical current responses (Fig. 2A-C) in this condition indicate that the reduction of external [Na+] from 150 mM to 88 mM was not enough to correct space control error. The maximal current densities recorded during low [Na+] were 32.0±2.0 pA/pF (P3–P6, n=7), 51.2±2.0 pA/pF (P7–P9, n=13), and 69.5±3.7 pA/pF (P10–P12, n=13) (Fig. 2F). They are significantly different (P<0.001). The current density–voltage relation is shown in Fig. 2E. The maximal current densities when [Na+] was normal were 84.8±7.8 pA/pF (P3–P6, n=18), 111±7.9 pA/pF (P7–P9, n=11), and 178.5±9.3 pA/pF (P10–P12, n=35) (data not shown). Though the reduction of the external [Na+] did not fully correct space clamp error, these results clearly showed Na+ current density increase with age.

Na+ currents recorded from neurons of different ages. The current protocol is shown above figures. In (A-C), the external [Na+] was reduced from 150 mM to 88 mM. Na+ currents recorded when [Na+] was 150 mM are shown in (D). Asterisks shown in figures indicate delayed response due to space clamp error. Current-voltage relations recorded in the low [Na+] condition are shown in (E). The peak current densities obtained from (E) are shown in (F). P, postnatal day; aCSF, artificial cerebrospinal fluid.
Fig. 3A shows the voltage dependent inactivation of Na+ currents. The graph shows that the inactivation curve has significantly shifted to the left with age. The Vhalf became gradually hyperpolarized from P3–P6 to P10–P12 (Fig. 3B) while slope factors did not show clear change with age. The Vhalfs were –38.0±1.1 mV (P3–P6, n=9), –42.1±0.4 mV (P7–P9, n=10), and –45.1±0.5 mV (P10–P12, n=14) and the slope factors were 4.4±0.4 mV (P3–P6, n=9), 5.2±0.5 mV (P7–P9, n=11), and 4.1±0.3 mV (P10–P12, n=14). Only half inactivation voltages are different significantly (P<0.001).

Inactivation of Na+ currents from neurons of different ages. Inset: Na+ currents in a P5 neuron. The voltage protocol is shown above the inset. (A) The fraction of peak currents (I/Imax) is plotted against the inactivation voltage. The smooth curve is the best fit to a modified first order Boltzmann equation. Half inactivation voltages obtained from (A) are shown in (B). Asterisks over columns indicate the statistical significance. P, postnatal day.
Fig. 4 shows the recovery of Na+ currents. With increasing age, the recovery time became shorter. The time constants were 4.7±0.5 (P3–P6, n=13), 2.8±0.2 (P7–P9, n=13), and 2.3±0.1 (P10–P12, n=21). They were significantly different (P<0.001).

Na+ current recovery from inactivation. The first Na+ current was elicited by step depolarization from –71.2 to –31.2 mV. After a 10-millisecond initial interval, 1 millisecond was added to each interval. A total of 25 sweeps were performed (A–C). The relative current (I/Imax) plotted as a function of interpulse interval was shown in (D), where a single exponential function was fitted to the data. (E) The time constants were 4.7±0.5 (P3–P6, n=13), 2.8±0.2 (P7–P9, n=3), and 2.3±0.1 (P10–P12, n=21). Asterisks over columns indicate the statistical significance. P, postnatal day.
DISCUSSION
Postnatal development of electrophysiological properties has been studied in many cortical and subcortical areas [19-21]. The developmental changes shown in this experiment, such as the gradual depolarization of the resting membrane potential, increase in action potential number and sodium current amplitude, decrease in input resistance, hyperpolarizing shift of the inactivation curve, and acceleration of Na+ current recovery are not new. They have already been reported in other areas of the brain [23-25] and even in the auditory cortex [15,16]. However, the exact time point when electrical properties of the auditory cortical layer II/III neurons change rapidly before hearing onset has not been reported yet.
In this study, the input resistance and membrane potential from P7 to P9 are 344.6±12 MΩ and –56.3±0.8 mV. They are around 300 MΩ and –63 mV in P8 Sprague-Dawley rats [15], and 400 MΩ and –65 mV in P10 Swiss Webster mice [16]. Considering that these animals are of different species, the values presented in this study are quite close to previously reported values. As other electrophysiological properties showed similar changes as those reported in previous results in rats and mice, the P3–P6 data presented in this study might be located after the extrapolation of previous results obtained from rats or mice older than P8 [15,16]. However, this extrapolation does not predict the real response of auditory cortical layer II/III neurons.
In many areas, neurons of early postnatal age (<P3) were reported to generate action potentials following current injection but action potential generation seems to depend on cell types and experimental condition. While P0 neurons obtained from the ferret dorsal lateral geniculate nucleus fire repetitive action potentials after a strong enough current injection [20], P1 neurons from the rat neocortex fire only single or double action potentials after current injection only when the membrane potential is clamped at a hyperpolarized potential with a steady hyperpolarizing current injection [21]. Theoretically, it is not natural to observe action potential firing neurons in the early postnatal period because resting membrane potentials are generally depolarized. The reported resting membrane potentials during P0–P5 [19-21] are quite close to the potential of half-maximal inactivation of sodium channel presented in this study, which would inactivate half of the sodium channels. In this study, RS or even OS-like cells have never been observed in mice younger than P3. Thus, OS-like cells might be a true cell type and not an artefact between P3 and P5. However, it is not clear whether the OS-like cell is a representative cell type which occurs from P0 to P5 because the most common cell type among P3–P6 layer II/III neurons was the non-spiking cell (not shown), not the OS-like cell. Though they were not included for analysis due to the possible neuronal damage during preparation, these non-spiking cells comprised 29 out of 46 cells. Considering that neurons do not fire well between P3 and P6, the possibility that non-spiking cells truly represent a cell type between P3 and P6 cannot be ruled out. According to Metherate and Aramakis [15], RS and OS cells belong to two different cell groups, in that, they differ in electrophysiological characteristics, location, and distribution during the P11–P20 interval. However, in this study, it is not clear whether RS and OS-like cells belong to different cell groups because RS cells were not observed from P3 to P6. Currently, what is clear is that RS cells were formerly OS-like or non-spiking cells during the P3–P6 period.
RS cells are mainly observed after P7. Many factors, such as hyperpolarizing shift in the activation threshold reported in the rat neocortex [24] and fast recovery of Na+ channels presented in this study, contribute to the emergence of action potential firing neurons from P7. Among them, the most influencing factor might be the increase in number of Na+ channels. In the rat neocortex, similar developmental increase in Na+ current resulting from the increase in the number of functional Na+ channels was reported [24]. The changes in single channel conductance was not thought to be involved, as single channel conductance has not been shown to change with development in the rat neocortex [22]. The same explanation might be applicable to this experiment. Computer modeling showing that increasing channel density alone lowers the threshold for the generation of action potentials also supports this idea [26].
In auditory cortex, acoustic-evoked potentials first occur in week 2 and develop most rapidly over weeks 2–3. Before that, development of neural connections throughout the auditory system depends primarily on spontaneous cochlear activity, the source of which is suggested to be Kölliker’s organ [27]. The emergence of RS cells from P7 indicates the increase in cortical responsiveness. Increased responsiveness is correlated with the arrival of peripheral inputs. In the rat sensory cortex, the distribution of thalamocortical afferents becomes virtually identical to that of adults by P4; they reach layer IV and extend into the deepest part of layer III, and the distribution of thalamocortical fibers does not greatly change after P7 [6]. Given that spontaneous activity in the inner ear contributes significantly to the development of the auditory system [28], the arrival of thalamocortical afferents at layers IV and III increases the possibility for spontaneous inputs to influence cortical development directly.
From the data presented here, it might be suggested that the responsiveness of cortical layer II/III changes after P7. The second postnatal week is important in brainstem auditory circuit development. A dramatic functional elimination of GABAergic/glycinergic synapses is completed by the end of the first postnatal week [8] and glutamate co-release from the MNTB terminal begins to decrease from P9 [7]. These changes, in addition to the spontaneous activity generated from cochlear inner hair cells, will affect cortical responsiveness. Whether this is just a coincidence or there is a causal relationship between increased cortical responsiveness and the second postnatal week is not clear. Further investigation involving the removal of the inner ear at P2 or P3 will elucidate the causal relationship.
HIGHLIGHTS
▪ Electrophysiological properties differed among postnatal day 3 (P3)–P6, P7–P9, and P10–P12 neurons.
▪ Appearance of regular spiking cells from P7 is mainly due to developmental maturation of Na+ channel.
Notes
No potential conflict of interest relevant to this article was reported.
Acknowledgements
This research was supported by the Basic Science Research Program through the National Research Foundation of Korea (NRF) which is funded by the Ministry of Education, Science, and Technology (2017R1D1A1A02018531).