Changes in Cortical Auditory Evoked Potentials by Ipsilateral, Contralateral and Binaural Speech Stimulation in Normal-Hearing Adults
Article information

Abstract
Objectives
Cortical auditory evoked potentials (CAEPs) have been used to examine auditory cortical development or changes in patients with hearing loss. However, there have been no studies analyzing CAEP responses to the different sound stimulation by different stimulation sides. We characterized changes in normal CAEP responses by stimulation sides in normal-hearing adults.
Methods
CAEPs from the right auditory cortex were recorded in 16 adults following unilateral (ipsilateral and contralateral) and bilateral sound stimulation using three speech sounds (/m/, /g/, and /t/). Amplitudes and latencies of the CAEP peaks in three conditions were compared.
Results
Contralateral stimulation elicited larger P2-N1 amplitudes (sum of P2 and N1 amplitudes) than ipsilateral stimulation regardless of the stimulation sounds, mostly due to the larger P2 amplitudes obtained, but elicited comparable P2-N1 amplitudes to bilateral stimulation. Although the P2-N1 amplitudes obtained with the three speech sounds were comparable following contralateral stimulation, the /m/ sound elicited the largest P2-N1 amplitude in ipsilateral stimulation condition due to the largest N1 amplitude obtained, whereas /t/ elicited larger a P2-N1 amplitude than /g/ in bilateral stimulation condition due to a larger P2 amplitude.
Conclusion
Spectrally different speech sounds and input sides are encoded differently at the cortical level in normal-hearing adults. Standardized speech stimuli, as well as specific input sides of speech, are needed to examine normal development or rehabilitation-related changes of the auditory cortex in the future.
INTRODUCTION
Cortical auditory evoked potentials (CAEPs) originate from the activity of excitatory postsynaptic potentials at the level of the thalamus and auditory cortex in response to a sound stimulation [1-4]. The CAEP waveform is sometimes referred to as the P1–N1–P2 complex, with major components occurring approximately 50, 100, and 180 ms after the onset of the stimulus in normal-hearing adults [5]. CAEPs can be used as an objective tool to evaluate whether amplified speech sounds are audible in infants and children fitted with hearing aids or cochlear implants and to investigate maturation, auditory processing and neural reorganization within the central auditory system [6-12]. Only a positive P1 wave is observed at birth, with a latency starting from 300 ms and decreasing down towards adulthood with the interim emergence of the P1–N1–P2 complex at central scalp locations by 9 to 12 years of age [4,6]. Substantial changes that extend from birth well into adolescence have been found for both the amplitude and latency of CAEP waveforms [4,13]. We speculated therefore that it would be useful to compare normative values from normal- hearing adults with a mature central auditory system to the individual values of the P1–N1–P2 complex when evaluating whether the auditory cortex of patients with hearing problems is encoding differently from normal hearing subjects at the cortical level. In addition, because a CAEP assessment is an objective technique that does not rely on collaboration from the listener, it can be used for adults with an intellectual impairment who cannot cooperate with behavioral speech discrimination testing [14].
There have been several studies of the CAEP responses in normal-hearing adults but mainly for research purposes using various stimulation sounds [4,15-17]. Because CAEPs produced by different speech sounds can differ based on the response latency and amplitude measures [1,15,16], normative values using standardized speech sounds would provide a reference value for each parameter. The detection and characterization of the CAEP responses in normal-hearing adults have been recently reported in many studies using a commercially available system [5,14,18-20].
When using CAEPs to optimize the cochlear implant (CI) fitting and verify cortical maturation in one ear, CAEP responses are recorded from the input to the CI, while the contralateral ear would be masked if hearing is good or unaided if hearing is impaired. In a normal hearing human, monaural stimulation produces a pattern of asymmetrical neuronal activation over the brain auditory network, where the contralateral projection pathway is dominant both anatomically and functionally as evidenced by shorter activation latencies and larger amplitudes compared to the ipsilateral ear [21,22]. However, it has not been previously reported how the CAEP responses change in accordance with the direction of the speech sound, i.e., ipsilateral, contralateral or bilateral auditory inputs.
Our present study aimed to systematically investigate the effects of sound stimulation type and input side on CAEP amplitudes and latencies in normal hearing subjects using a commercially available system.
MATERIALS AND METHODS
Subjects
Participants were 16 right-handed young adults (aged 23–33 years) with normal hearing sensitivity, a 5-dB interaural threshold difference in the 250–8,000 Hz octave frequencies, and no history of otological problems. There were 10 female and six male participants. This study was approved by the Institutional Review Board of Asan Medical Center (IRB No. 2018-1477). Because of the retrospective nature of this study, the need for written informed consent was waived by the review board.
CAEP procedures and stimuli
Listeners were seated in a chair 1 m from the loudspeaker and remained alert. All measurements were made in a sound-treated and electrically screened test room using the cortical assessment protocol for the HEARLab system (Frye Electronics, Tigard, OR, USA). After preparing the scalp, disposable electrodes (Ambu BlueSensor, Ballerup, Denmark) were attached to the head at the vertex (Cz, positive active), right mastoid (negative reference), and high forehead (ground). Electrode impedance was maintained below 5 kΩ.
Three stimuli (/m/, /g/, and /t/) extracted from running speech by a manufacturer were transmitted from a single loudspeaker at 0° azimuth at a 65 dB SPL. These stimuli were presented with an inter-stimulus interval of 1,125 ms with dominant energy peaks at 500, 1,500, and 3,000 to 4,000 Hz and represent speech with dominant energies at low, mid, and high frequencies, respectively [5]. The stimuli were presented in blocks of 25 (rotating through /m/, /t/, and /g/ after each block) until a minimum of 150 accepted responses were obtained for each stimulus.
The order of testing for the three conditions (contralateral, ipsilateral, and binaural conditions) was maintained across the 16 participants. An earplug (E.A.R. Classic Plugs, Aero Inc., Indianapolis, IN, USA) was inserted into the subject’s right ear under the contralateral condition or left ear under the ipsilateral condition with a reference electrode placed on the right mastoid. This testing was then repeated without an earplug. The ear which was plugged showed attenuated air conduction hearing thresholds in the 250 to 4,000 Hz range by between 30 to 47 dB HL [23].
Decisions regarding response detection and waveform differentiation were performed objectively using the automated statistical procedure on the HEARLab system, which applies the Hotelling’s T2 statistic [24]. The amplitudes and latencies of the peak waveforms (P1, N1, and P2) were calculated offline and compared (Fig. 1).
Cortical auditory evoked potential (CAEP) waveforms in a normal hearing subject. In ipsilateral sound stimulation (A), contralateral sound stimulation (B), and bilateral sound stimulation (C), the actual CAEP waveforms for three natural speech sounds (/m/, /g/, and /t/) at 65 dB SPL are shown.
Statistics
Statistical analyses were performed using IBM SPSS ver. 21.0 (IBM Corp., Armonk, NY, USA). Repeated measure analysis of variance test with post-hoc Bonferroni analysis was applied to compare the CAEP amplitudes and latencies by sound stimulation type and input side. Significance was determined when the probability level (P) was <0.05.
RESULTS
The CAEP components P1, N1, and P2 were recorded successfully for all speech stimuli (/m/, /g/, and /t/) at the Cz electrode for all adult participants in this study. An example of the waveforms from one subject for the ipsilateral, contralateral, and bilateral sound stimulation conditions is shown in Fig. 1. The mean±standard deviation values of the amplitudes and latencies of the waveforms in response to the /m/, /g/, and /t/ speech stimuli are presented in Table 1.
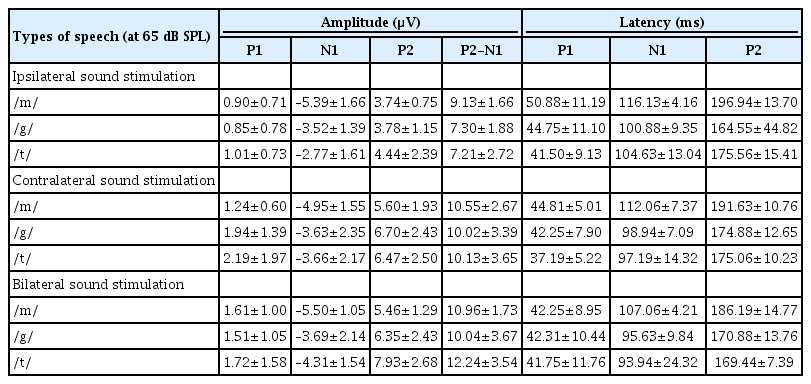
Amplitudes and latencies of the CAEP responses from normal-hearing adults
Changes in the CAEP waveforms with ipsilateral, contralateral and bilateral speech stimulation
Contralateral stimulation elicited larger P2-N1 amplitudes (sum of P2 and N1 amplitudes) than ipsilateral stimulation but similar P2-N1 amplitudes to bilateral stimulation, regardless of the speech types (Fig. 2A). This difference was mostly derived from the significant larger P2 amplitudes in the contralateral stimulation condition compared to the ipsilateral stimulation as the N1 amplitudes were comparable under both conditions (Fig. 3A). N1 and P2 latencies evoked by the bilateral stimulation occurred significantly earlier than unilateral (ipsilateral and contralateral) stimulations (Fig. 3B).
Changes in P2-N1 waveform amplitudes by input side (A) and speech sound type (B) in normal-hearing adults. Ipsi, ipsilateral; Contra, contralateral; Bi, bilateral. Repeated measures analysis of variance with post-hoc Bonferroni, *P<0.05, **P<0.01, ***P<0.001.

Changes in amplitudes (A) and latencies (B) of the cortical auditory evoked potentials responses by input side of speech stimulation in normal-hearing adults. The N1 peak amplitudes were converted to positive values, which are shown as a mean±standard error of mean. Repeated measures analysis of variance with post-hoc Bonferroni, *P<0.05, **P<0.01, ***P<0.001.
P1 amplitudes elicited by the ipsilateral stimulation were smaller than those obtained from the contralateral and bilateral stimulation, although this was significant only for the /g/ and /t/ speech sounds (Fig. 3A). The P1 wave latencies associated with the bilateral /m/ stimulation were shorter than those for the ipsilateral /m/ stimulation (Fig. 3B).
CAEP waveform changes with different speech sounds
Although the P2-N1 amplitudes obtained for the three different speech sounds tested in our current analyses were comparable under contralateral stimulation condition, the /m/ speech sound elicited the largest P2-N1 amplitude following ipsilateral stimulation (Fig. 2B). More specifically, the /m/ sound elicited the largest N1 amplitudes among the three speech sounds tested (Fig. 4A), whereas all produced comparable P2 amplitudes under ipsilateral stimulation.

Changes in amplitudes (A) and latencies (B) of the cortical auditory evoked potential responses by speech sound type in normal-hearing adults. The N1 peak amplitudes were converted to positive values, which are shown as a mean±standard error of mean. Repeated measures analysis of variance with post-hoc Bonferroni, *P<0.05, **P<0.01, ***P<0.001.
In the bilateral stimulation condition, /t/ speech elicited larger P2 amplitudes than /m/ and /g/, though /m/ elicited larger N1 amplitude than /g/ and /t/ (Fig. 4A). Thus, P2-N1 amplitude of /t/ was comparable to /m/, but significantly larger than that of /g/ (Fig. 2B). P1 waveforms elicited by /t/ stimulation showed a trend toward larger amplitudes and shorter latencies than those by /m/ stimulation, but this was not always significant (Fig. 4).
DISCUSSION
Specific neural substrates contributing to each peak of a CAEP response have been reported. The P1 wave is thought to originate from the primary auditory cortex and thalamus, and reflects the sum of the synaptic signals transmitted along the ascending auditory pathway [25-27]. P1 latency occurs at around 300 ms in newborns, decreases rapidly over the first 2 to 3 years of life, and then gradually decreases over the second decade of life until reaching a mature adulthood latency of around 60 ms [4,6,28-30]. P1 latency has thus been used as a biomarker of cortical maturation by comparing responses from patients with hearing loss to normative data [6]. In our current study, P1 latencies in young adults were found to be comparable to those of previous reports, and those produced by bilateral stimulation (41.8–42.3 ms) tended to be shorter than those (41.5–50.9 ms) elicited by ipsilateral stimulation (Fig. 3B). Although it was reported that the P1 amplitude in adults did not differ significantly between speech sounds, due to its small size as indicated in a previous report [31], the P1 amplitudes elicited by contralateral or bilateral stimulation tended to be larger than those obtained by ipsilateral stimulation in our current investigation (Fig. 3A). Moreover, /m/ elicited larger P2-N1 amplitudes compared with /g/ and /t/ in ipsilateral stimulation condition and /t/ elicited larger P2-N1 amplitudes compared with /g/ in bilateral stimulation condition, suggesting that the different stimuli with the different spectral component are processed differently at the cortical level. This difference in the CAEP response by speech sound type was found previously to be significant in a group comparison, but not at the individual comparison level [5].
The later components, N1 and P2, are thought to reflect higher levels of auditory cortical processing from cortical-cortical circuits, thalamocortical pathways, and the secondary auditory cortex [27,29]. In our current analysis, the type and input side of the sound stimuli elicited significantly different P2-N1 responses in normal-hearing adults.
Contralateral stimulation elicited larger P2-N1 amplitudes than ipsilateral stimulation, but comparable P2-N1 amplitudes to the bilateral stimulation condition. This difference in P2-N1 amplitudes mostly derived from the significant increase in P2 amplitudes under contralateral and bilateral stimulation compared to ipsilateral stimulation. These findings suggest that contralateral recording with higher amplitudes of P2-N1 responses can be the better way to record CAEPs. Previously, there have been many studies where the CAEP was recorded on either side, e.g., a reference electrode on the right side, a preferred side or a randomized side [5,14,15,18]. Thus, CAEP responses might be better recorded from the contralateral cortex to the tested ear when evaluating auditory responses using a CAEP in one ear. Many prior electroencephalographic, magnetoencephalographic and functional magnetic resonance imaging studies have reported that there is greater activity in the hemisphere contralateral to the ear of stimulation, though some contradictory findings have been described [32-35]. In accordance with the existing literature, our present investigation found that CAEPs exhibited larger amplitudes following contralateral sound stimulation compared to ipsilateral sound stimulation. Contralateral and bilateral stimulation elicited larger P2-N1 amplitudes than ipsilateral stimulation, suggesting that crossed pathways generate larger responses than uncrossed pathways.
Although the P2-N1 amplitudes produced by the three different speech sounds were comparable under the contralateral and bilateral stimulation conditions, the /m/ sound type elicited the largest P2-N1 amplitude under ipsilateral stimulation due to its generation of the larger N1 amplitude, suggesting that spectrally different speech sounds are encoded differently at the cortical level [5,15]. It has been reported that the N1 amplitudes generated after stimulation at 250 Hz were significantly larger and with longer latencies than those obtained after stimulation at 1,000 or 4,000 Hz. The low-frequency /m/ sound might be processed differently from /t/ sound through an uncrossed pathway to the auditory cortex, with significantly larger amplitudes from /m/ by ipsilateral stimulation. This might be partially explained by the fact that the auditory cortex is tonotopically tuned, with high frequencies being represented more medially, and low frequencies being represented more laterally [31,36]. As was seen in a previous report and from our present results (Fig. 4), disparate speech stimuli, such as those with a high and low-frequency emphasis, produce CAEPs that can be differentiated in many participants [15]. However, the plosive speech contrasts /t/ and /g/ which are relatively similar in spectral content and amplitude-time envelopes did not reliably result in different CAEP waveforms in another report [5]. In that prior study, it was possible to differentiate /m/ and /t/ in approximately 80% of listeners, which was approximately 60% for /m/ and /g/ and <20% for /t/ and /g/ at the presentation level of 65 dB SPL.
In summary, different sound stimuli in different input sides elicit significantly different CAEP responses in normal-hearing adults suggesting that different input sides and spectrally different speech sounds are encoded differently at the cortical level. These findings have implications for future studies of CAEPs utilizing standardized speech stimuli, as well as specific input sides of speech to examine normal development of auditory cortex or rehabilitation-related changes of auditory cortical activity in patients with hearing loss.
HIGHLIGHTS
▪ Cortical auditory evoked potentials represent response of auditory cortex to a sound stimulation.
▪ Sounds from different input sides are encoded differently at the cortical level.
▪ Spectrally different speech sounds are also encoded differently at the cortical level.
Notes
No potential conflict of interest relevant to this article was reported.
Authors’ contribution
Conceptualization: JYL, BCK, HJP. Data curation: JYL, BCK. Formal analysis: JYL, BCK, HJP. Methodology: JYL, BCK, JWP. Project administration: HJP. Visualization: JYL, BCK. Writing - original draft: JYL, BCK. Writing - review & editing: all authors.