Hyaluronan Synthase 1: A Novel Candidate Gene Associated With Late-Onset Non-syndromic Hereditary Hearing Loss
Article information
Abstract
Objectives
Hyaluronan synthase 1 (HAS1) is a membrane-bound protein that is abundant in the epidermis and dermis, and it is important for skin function. However, its association with hearing loss has not yet been studied. Herein, we sought to evaluate the potential contribution of HAS1: c.1082G>A to genetic hearing loss.
Methods
We used whole-exome sequencing to analyze blood DNA samples of six patients of a family with autosomal dominant familial late-onset progressive hearing loss, which was revealed to be related to a variant of the HAS1 gene. Confirmatory Sanger sequencing was performed with samples from 10 members. A missense variant was detected in HAS1 (c.1082 G>A, p.Cys361Tyr). In silico analyses predicted this variant to result in the functional loss of HAS1. Immunostaining was conducted using wild-type mouse samples to verify HAS1 expression.
Results
Has1 was detected in an otocyst at E10.5. In the pup, Has1 expression was localized in the stria vascularis (SV), hair cells, supporting cells of the organ of Corti, and some spiral ganglion neurons. SV marginal cells markedly expressed Has1 in the adult stage. The hearing threshold in the Has1-depleted condition was investigated by accessing the International Mouse Phenotyping Consortium’s Auditory Brainstem Response (ABR) data. ABR of Has1 knock-out mice showed threshold elevations at 6, 12, and 18 kHz in young male adults.
Conclusion
HAS1 may have a close relationship with auditory function and genetic hearing loss. Further investigation is needed to reveal the precise role of HAS1 in the auditory system. HAS1 is a candidate gene for future hereditary hearing loss genetic testing.
INTRODUCTION
Hereditary hearing loss (HHL) is receiving increasing interest owing to recent advancements in next-generation sequencing (NGS). The cost of NGS is continually decreasing, making it possible to evaluate the genetic basis of the condition in increasingly many patients with hearing loss. Thirty percent of HHL cases are syndromic and combined with other symptoms [1], while the remaining 70% are non-syndromic. Among cases of non-syndromic HHL, 80% are autosomal recessive and 20% are autosomal dominant [2]. Autosomal recessive HHL usually presents with hearing loss from the time of birth, resulting in prelingual deafness, whereas autosomal dominant HHL often shows late-onset progressive hearing loss. To date, more than 120 genes have been identified as causing non-syndromic HHL (http://hereditaryhearingloss.org).
Hyaluronan, which is one of the major components of the extracellular matrix, is produced by hyaluronan synthase (HAS). HAS is a membrane-bound protein that is abundant in the epidermis and dermis [3]. Three HAS genes have been identified in humans: HAS1, HAS2, and HAS3. These isoforms have been reported to have different degrees of stability: HAS3 is the most stable protein, HAS2 is less stable, and HAS1 has the least stability [4]. HAS1 is known to be expressed especially in fibroblasts and has important skin functions [3], whereas its expression and function in the auditory organs are largely unknown.
In the present study, we conducted whole-exome sequencing (WES) in a familial case of late-onset progressive severe hearing loss, which was revealed to be related to the HAS1 gene. We further evaluated the expression and function of HAS1 in the auditory system.
MATERIALS AND METHODS
Participants and clinical evaluation
We evaluated family members of a patient who sought care at a tertiary hospital due to severe hearing loss and received a cochlear implant. A four-generation familial pedigree was obtained. Twelve members of the family (6 affected and 6 unaffected) were subjected to pure tone audiometry and auditory brainstem response (ABR) tests for evaluating their hearing. Peripheral blood samples were collected from 10 of the 12 family members (5 affected and 5 unaffected) for DNA extraction. The study was approved by the Institutional Review Board of Chonnam National University Hospital (IRB No. CNUH-2014-132). All participants provided their informed consent prior to their participation in the study.
DNA isolation from patient blood samples
Genomic DNA was extracted from the patients’ peripheral blood using the DNeasy Blood & Tissue kit (Qiagen, Hilden, Germany). DNA quality was verified by agarose gel electrophoresis and DNA quantification was performed by spectrophotometry (NanoDrop 2000; Thermo Fisher Scientific, Waltham, MA, USA).
Exome capture and sequencing
After quality control to ensure the absence of genomic degradation, DNA samples (1 μg) were subjected to library preparation. Libraries with short inserts of 350–450 bp for paired-end reads were prepared using the Truseq DNA Sample Preparation kit (Illumina, San Diego, CA, USA) following the manufacturer’s protocol. Whole-exome DNA was sequenced using Illumina HiSeq 4000 at Theragen Etex, South Korea, including an adaptation of the pairwise end-sequencing strategy. In the current study, we performed WES using samples from three affected and three unaffected family members.
Post-sequencing analysis
Burrows-Wheeler aligner (BWA v. 0.6.2) was used to align the sequencing reads, with default parameters, to the Genome Reference Consortium assembly (GRCh37). Alignments were converted from the sequence alignment map format to sorted, indexed binary alignment map files (SAMtools v. 0.1.18). Picard was used to remove duplicate reads. Genome Analysis Toolkit (GATK) software tools (v. 2.3) were used for improving alignments and genotype calling and for refining the default parameters. Genotypes were called using the GATK UnifiedGenotyper, and the GATK VariantRecalibrator tool was used to score variant calls through a machine learning algorithm and to identify a set of high-quality single nucleotide polymorphisms using the Variant Quality Score Recalibration procedure with default parameters. In addition, all variants from both platforms were functionally annotated using databases from Exome Variant Server (6500). In the last filtering step, markers with GC contents of less than 40% or more than 60% were selected for subsequent downstream analysis.
Validation of variants by Sanger sequencing
Variants for Sanger sequencing validation were randomly selected from the following filters- column filters: pass, ANN impact: moderate, rsID: yes, ExAC: more than average, 1000 Genomes: Caucasian, African high frequency (more than average): filter out, GC_contents: high (maximum) & low (minimum), Korean Center for Disease Control Data Base (KCDCDB) frequency: 0.3–1 homo (10%), hetero (90%, 0/1). Polymerase chain reaction (PCR) primers were designed using Primer 3 software to amplify DNA fragments (ranging in size from 100 bp to 200 bp) with the variants of interest approximately in their center of the sequences. PCR reactions were performed in a 10 μL volume, containing 5 μL of AmpliTaq Gold Fast PCR Master Mix (Applied Biosystems, Foster City, CA, USA), 1.5 μL of each primer at a concentration of 0.5 pmol/μL, and 2 μL of genomic DNA at a concentration of 40 ng/μL. After quality control steps using agarose gel electrophoresis, the product was purified and pooled. Final PCR products were quantified using a Qubit fluorometer (Invitrogen, Carlsbad, CA, USA), and conventional Sanger sequencing was finally performed. First, we conducted NGS and Sanger sequencing with six samples (three unaffected and three affected) resulting in 10 candidate genes as follows: CHD1, CACNA1B, POC1B, VEZT, LGALS3, ZCCHC14, BCAM, HAS1, LILRB5, and KIAA1671. Then, we further validated these 10 variants including samples of four more family members (two affected and two unaffected). Ten samples (five affected and five unaffected) were evaluated in total, leaving HAS1 as the final candidate variant gene. We submitted the variant to Leiden Open Variation Database 3 (Variant #0000791276).
Bioinformatic analysis
For variant annotation, we used snpeff 4.1 g. Pathogenicity prediction of variants was performed with Sorting Intolerant from Tolerant (SIFT), Polymorphism Phenotyping v2 (PolyPhen2), MutationTaster and REVEL algorithms by dbNSFP4.2 (http://database.liulab.science/dbNSFP).
Animals and sample preparation, cryosection
We used C57Bl/6 wild type (WT) mice. The number of pregnant female mice (Jax Mice & Services, Bar Harbor, ME, USA) purchased was as required in each embryonic stage timepoint. Mice were euthanized by decapitation under ketamine/xylazine anesthesia. For embryo studies, each sample was washed with phosphate-buffered saline (PBS) and fixed in 2% paraformaldehyde (PFA) at 4°C for 1 hour. Adult mouse cochleae were locally perfused through the round window and further fixed with 4% PFA at room temperature for 2 hours. Then, samples were rinsed with PBS and decalcified with 5% ethylenediaminetetraacetic acid (EDTA) at 4°C for 3–5 days. All samples were embedded in optimal cutting temperature compound (Leica Biosystems, Buffalo Grove, IL, USA) and quickly frozen in dry ice. Sample blocks were sectioned with a Cryostat (Leica CM1850) at 5–20 µm thickness. The animal study was approved by the Chonnam National University Hospital Institutional Animal Care and Use Committee (CNU IACUC-H-2018-42).
Immunostaining
The blocking step was performed in blocking buffer (donkey serum 1:100 in 0.1% PBS-Tween) at room temperature for 1 hour, followed by incubation with the primary antibody at 4°C overnight. After washing, the samples were incubated with secondary antibody (1:1,000 in blocking buffer) at room temperature for 1 hour. Samples were washed thrice with 0.1% PBS-Tween for 30 minutes, stained with 4′,6-diamidino-2-phenylindole (DAPI) for 10 minutes, and were washed with PBS for 30 minutes. Samples were mounted on glass slides with Vectashield (Vector laboratories, Newark, CA, USA) solution and analyzed with an LSM 510 laser scanning microscope (Carl Zeiss Micro Imaging GmbH, Göttingen, Germany). The primary antibodies and titers used in this work were as follows: HAS1 (either goat, 1:200, Santa Cruz Biotechnology #SC-23145, Dallas, TX, USA; or rabbit, 1:200, Abcam #ab198846, Cambridge, UK), HAS2 (rabbit, 1:200, Santa Cruz Biotechnology #SC-66916), HAS3 (goat, 1:200, Santa Cruz Biotechnology #SC-34204), ICAM2 (rat, 1:200, BioLegend #105602, San Diego, CA, USA), Sox2 (rat, 1:200, eBioscience #14-9811-82, San Diego, CA, USA). All secondary antibodies were applied according to the origin of the primary antibody (Jackson ImmunoResearch, Jackson Grove, PA, USA). DAPI (Invitrogen) was used at 1:10,000 titer.
Has1-mutant mice hearing threshold analysis: public data from the International Mouse Phenotyping Consortium
To evaluate the hearing level of mice with depleted Has1, we accessed International Mouse Phenotyping Consortium (IMPC)’s public data (www.mousephenotype.org) [5]. Numbers of mouse ABR data were as follows: Female WT (n=230), Female KO (n=2), Male WT (n=228), Male KO (n=2). ABR data were analyzed with R 4.0.2 using a Wilcoxon rank sum test. The P-values below 0.05 were considered statistically significant.
RESULTS
Patterns of inheritance and hearing loss, and cochlear implant outcomes
Hearing impairment affected every generation of the studied family, including both male and female members, showing autosomal dominant inheritance (Fig. 1). None of the family members had other accompanying syndromic phenotypes. The medical history of the affected patients revealed that their hearing was normal from birth until puberty, and they all had normal lingual development. By the age of 15, auditory function started to decrease in both ears. At around age 20, their hearing deteriorated into moderate to severe hearing loss (Two male patients, IV-1 and IV-2) (Fig. 2). At age 40, profound deafness occurred (1 male and 2 female patients, III-1, III-2, III-3). It showed a lateonset progressive severe hearing loss pattern. None of the patients had vestibular symptoms, except for one with non-specific intermittent dizziness (III-3); this patient was also the only one who complained of tinnitus (a buzzing sound). Two female patients underwent cochlear implantation (CI). Preoperative computed tomography and magnetic resonance imaging showed no anatomical anomalies in the cochleae, vestibules, and vestibulocochlear nerves (Fig. 3A, B, D, and E). The CI outcomes were favorable, and the CI-aided pure tone average thresholds were around 30 dB (Fig. 3C and F).

Familial pedigree of non-syndromic hereditary hearing loss showing an autosomal dominant inheritance pattern. Red boxes indicate participants who were studied by whole-exome sequencing (3 with hearing loss [II-2, III-1, and III-3] and 3 with normal hearing [II-1, III-4, and IV-3]).

Pure tone audiometry assessment showing a late-onset progressive severe hearing loss pattern. Hearing loss started in both ears as early as age 15 (patients III-1 and IV-2) and gradually deteriorated afterwards. At age 23, patient IV-1 showed moderate-to-severe hearing loss, and profound deafness occurred around age 40 (III-1, III-2, and III-3). TA, age at audiometry test; OA, age at onset of hearing impairment.
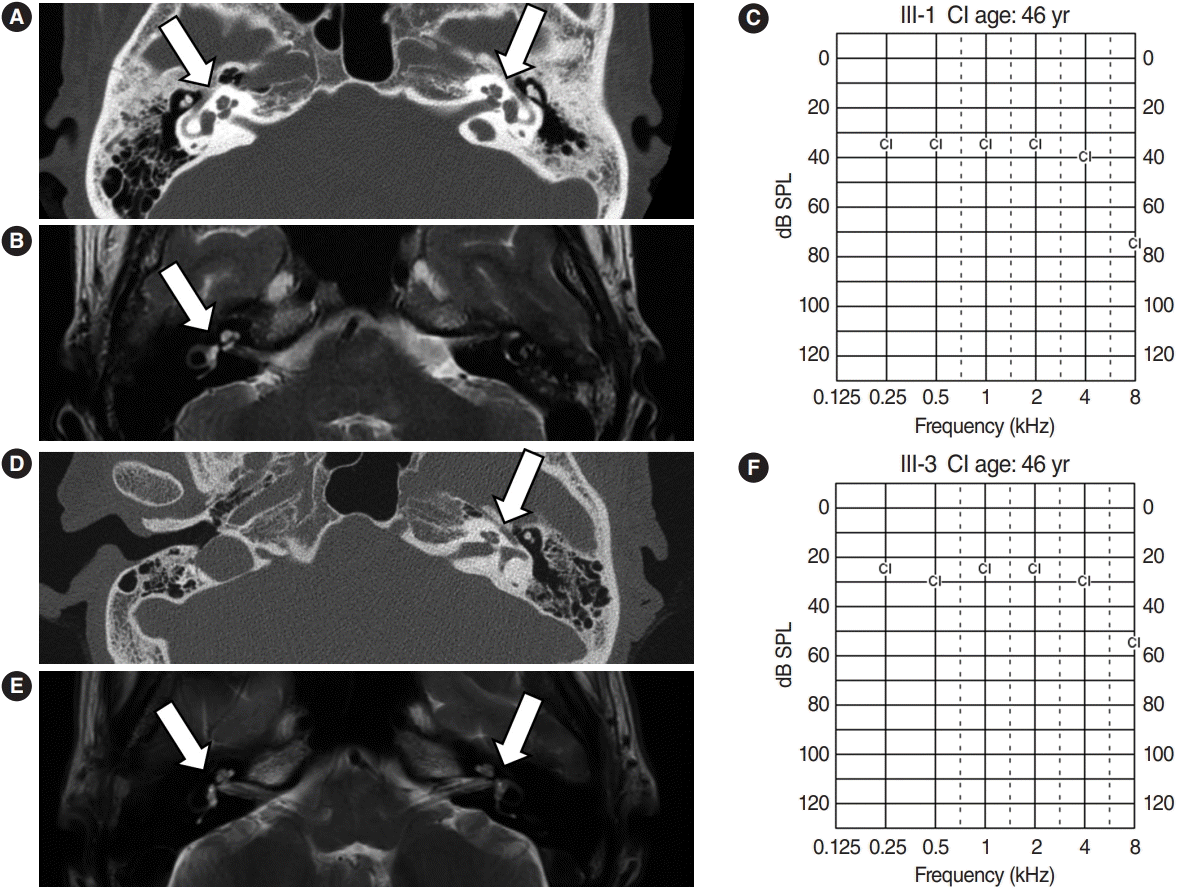
Normal inner ear anatomy and good outcomes after cochlear implantation (CI) in deaf family members. Temporal bone computed tomography (CT) (A), temporal magnetic resonance imaging (MRI) (B), and postoperative CI-aided pure tone average (PTA; C) results of patient III-1. CT (D), MRI (E), and postoperative CI-aided PTA (F) results of patient III-3. Both patients had no cochleovestibular anomalies (arrows) and showed good hearing performance after CI.
WES and Sanger sequencing revealed a missense variant of HAS1
We performed WES using samples from three affected (II-2, III-1, and III-3) and three unaffected (II-1, III-4, and IV-3) participants (Fig. 1). The result showed 10 candidate gene variants (Supplementary Table 1). These results were confirmed with Sanger sequencing using samples from five affected and five unaffected family members (Fig. 4A). Our final results revealed a point variant at chromosome 19, locus 52217335 (Fig. 4B). The gene name was hyaluronan synthase 1 (NM_001523.3), where at position 1,082, guanine was mutated to adenosine (c.1082G>A). Consequently, a cysteine residue was replaced by tyrosine (p.Cys361Tyr). In silico analysis was performed using SIFT and PolyPhen2. Both tools predicted that the change should be “damaging” to protein function (Fig. 4C). Another in silico analysis by Mutation Taster and REVEL predicted this variant as having “disease-causing” potential (REVEL score 0.76) (Fig. 4C).

Whole-exome sequencing and Sanger sequencing revealed a missense point variant of HAS1. (A) Sanger sequencing confirmed a point variant in hearing-impaired family members. (B) Missense point variant on chromosome 19 in the hyaluronan synthase 1 (HAS1) gene (c.1082G>A). (C) “Damaging” and “disease-causing” were the predictions of in silico analyses by Sorting Intolerant from Tolerant (SIFT), Polymorphism Phenotyping v2 (PolyPhen2), Mutation Taster, and REVEL. TA, age at audiometry test; OA, age at onset of hearing impairment.
Has1 is detected during development of the mouse otic vesicle
We evaluated the expression and localization of Has1 in the auditory organs. First, it was evaluated during development in a murine model. At age E10.5, Has1 was detected and localized in the otocyst. The apical membrane of cells lining the lumen robustly expressed Has1 in both the prosensory and non-sensory regions (Fig. 5). Has1 expression was detected in the cells at E12.5 and E16.5. At E16.5, Has1 localization was observed in the stria vascularis (SV). To date, 3 hyaluronan synthases have been identified: HAS1, HAS2, and HAS3. Unlike Has1, Has2, and Has3 were not detected in the otic vesicle at E14.5 and E16.5 (Supplementary Fig. 1) through immunostaining.
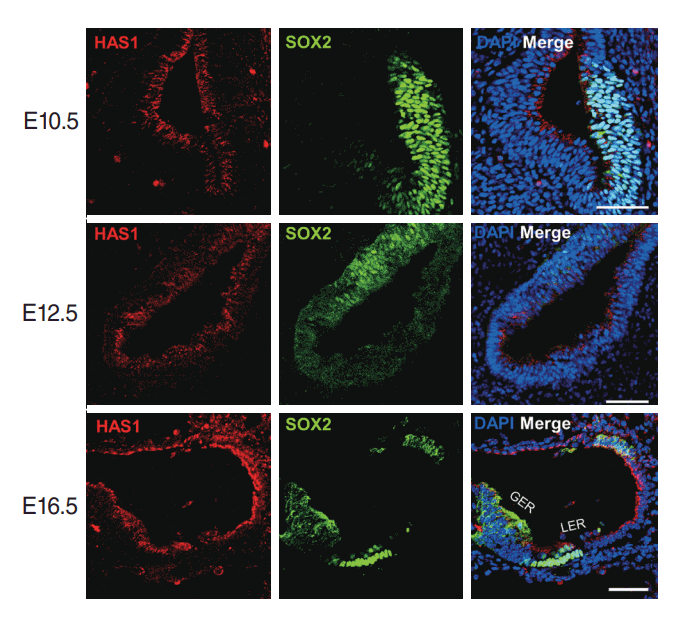
HAS1 localization in the otic vesicle during mouse embryonic development. HAS1 was already expressed at E10.5 on the apical part of cells lining the luminal surface of the otic vesicle. HAS1 expression continued at E12.5. At E16.5, HAS1 was expressed in the apical membrane of the greater epithelial ridge (GER) region, lateral wall, and hair cells. DAPI, 4′,6-diamidino-2-phenylindole; LER, lesser epithelial ridge. Scale bar: 50 μm.
Has1 localization in the SV and organ of Corti after birth
We further checked the expression and localization of this protein in later stages. At postnatal day 3, both inner and outer hair cells of the organ of Corti showed Has1 expression. Supporting cells in the inner and outer sulci also showed weak Has1 expression (Fig. 6A and B). In the lateral wall, Has1 continued to be detected on the apical membrane of SV marginal cells (Fig. 6C). Some spiral ganglion cells also showed Has1 expression (Fig. 6D).
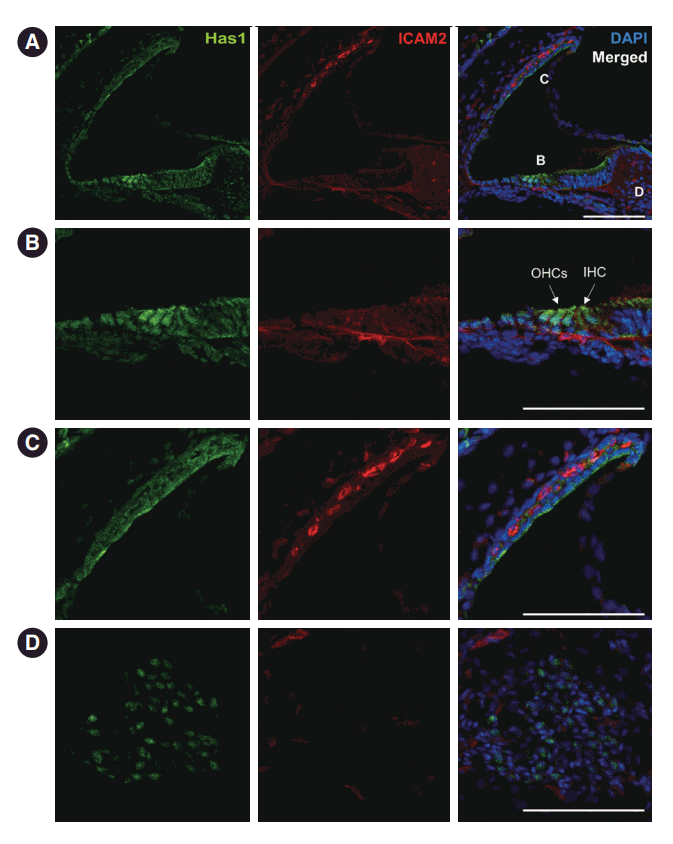
Has1 expression in neonatal mouse cochlea. (A) Postnatal day 3. Has1 was detected in the cochlea. Intercellular adhesion molecule 2 (ICAM2), an endothelial cell marker, indicates cochlear vessels. (B) Magnified view of the organ of Corti in (A) showing Has1 expression in the inner hair cell (IHC) and outer hair cells (OHCs). Has1 was also weakly expressed in supporting cells and inner sulcus cells. (C) Magnified image of the stria vascularis in (A). The apical membrane of marginal cells showed Has1 expression. (D) Magnified image of the spiral ganglion region in (A). Some spiral ganglion cells also expressed Has1. DAPI, 4′,6-diamidino-2-phenylindole. Scale bar: 100 μm.
This pattern was maintained in the adult stage, and it was the most robust at the apical membrane of marginal cells in the SV (Fig. 7A and C). Has1 localization signals in the outer and inner hair cells and supporting cells in the organ of Corti were weak compared to those observed in the SV (Fig. 7B). In the vestibular organ, Has1 localization signals were strong in vestibular hair cells and not detected in underlying supporting cells (Supplementary Fig. 2). Has1 localization was observed in some cochlear spiral ganglion cells at the adult stage (Fig. 7D).
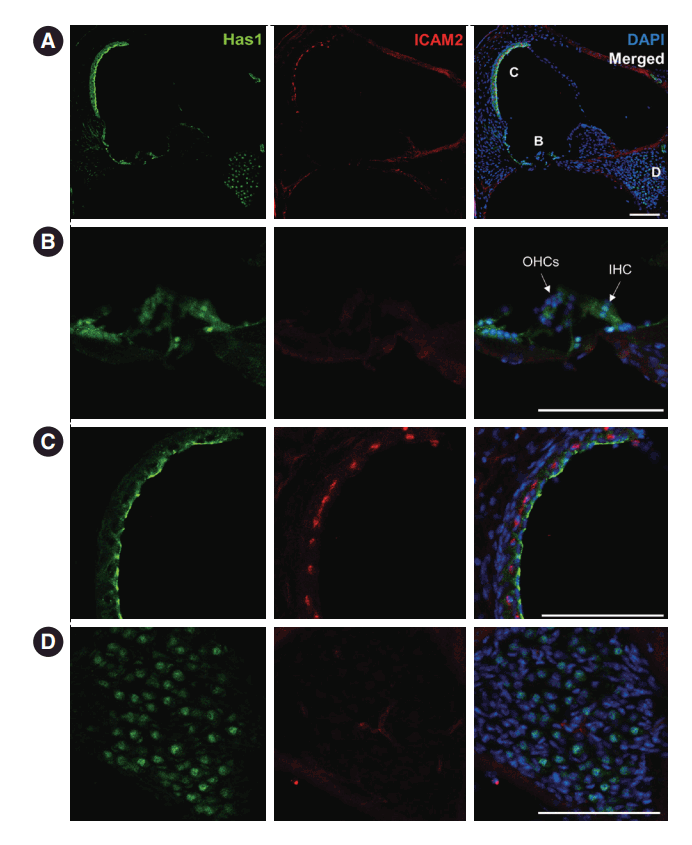
Has1 expression in adult mouse cochlea. (A) Has1 expression was more confined within the stria vascularis (SV) in 7-week-old mice. (B) Magnified view of the organ of Corti in (A). The expression in hair cells was weaker than in the SV. Hensen’s and Claudius cells showed similarly weak expression of Has1. (C) Magnified view of the SV in (A). Has1 was robustly localized in the apical membrane of SV marginal cells. (D) Magnified image of the Rosenthal canal. Has1 was detected in some spiral ganglion cells. ICAM2, intercellular adhesion molecule 2; DAPI, 4′,6-diamidino-2-phenylindole; OHC, outer hair cell; IHC, inner hair cell. Scale bar: 100 μm.
Has1 deletion caused low-frequency hearing loss in young adult male mice: IMPC mouse phenotype data
We searched IMPC’s public database for the knock-out (KO) phenotype for Has1 (Fig. 8). The overall click ABR threshold was similar between WT and Has1-deleted mice (no significant association, performed in 14-week-old mice). However, interestingly, male KO mice showed an elevated ABR threshold at 6 kHz (KO threshold: 65 dB [65–65 dB] vs. WT threshold: 47.6 dB [36.6–58.5 dB]). This threshold was also elevated at 12 kHz (KO threshold: 47.5 dB [44–51 dB] vs. WT threshold: 29.4 [18.9–39.9]). Significant hearing loss was also observed at 18 kHz. The hearing thresholds of female KO mice were comparable to those of WT animals at all frequencies.
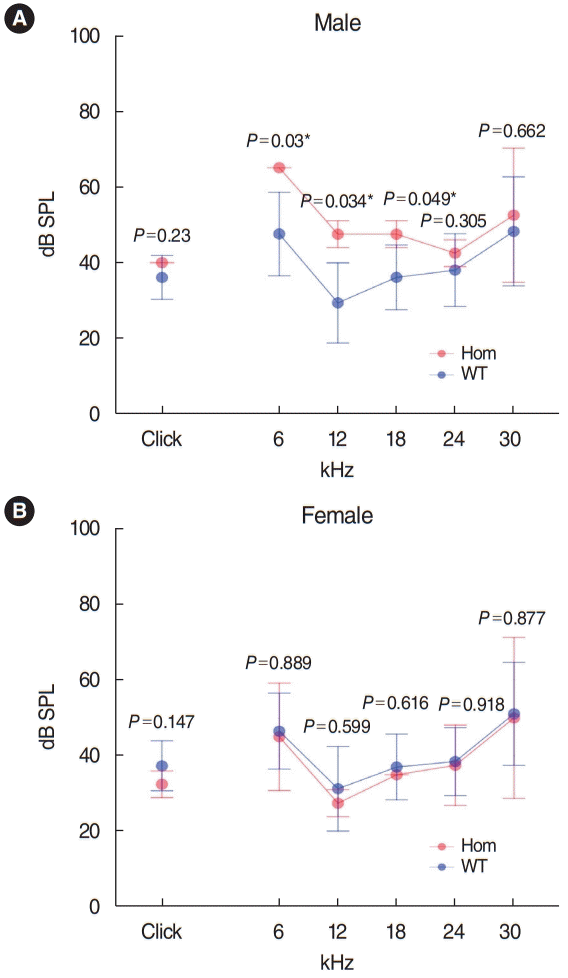
Hearing threshold elevation in Has1 knock-out (KO) mice. Hearing levels of 14-week-old Has1 KO mice. Female Has1 KO hearing levels were comparable to those of wild-type (WT) mice (female WT: n=230, female KO: n=2). Male Has1 KO mice showed significant elevations in their hearing thresholds (male WT: n=228, male KO: n=2, P<0.05) at 6, 12, and 18 kHz compared to the WT control mice. Public data from International Mouse Phenotyping Consortium (www.mousephenotype.org) were analyzed with R version 4.0.2 (using the ilcoxon rank sum test). Hom, homozygote. *Statistically significant, P<0.05.
DISCUSSION
The family with HHL in this study showed an autosomal dominant trait. To date, 51 genes have been identified as related to autosomal dominant non-syndromic hearing loss (http://hereditaryhearingloss.org). Compared to the autosomal recessive type, which usually presents with severe hearing loss at birth, the autosomal dominant disease shows normal or mild hearing loss during early life [6,7]. Starting from the second decade of life, hearing loss progresses and increases in severity. The family assessed in the current study had a hearing pattern similar to that of previous cases. The earliest recorded onset of hearing loss was in a 15-year-old patient. One affected participant, who was 20 years old, had mild to moderate hearing loss (IV-2) (Fig. 2), and a 23-year-old had moderate to severe hearing loss (IV-1) (Fig. 2). Two family members in their early 40s showed severe hearing loss (III-2 and III-3) (Fig. 2), while one aged 46 years showed complete deafness (III-1). The hearing loss pattern was typical of late-onset progressive severe hearing loss. All participants had normal linguistic development (post-lingual deafness) and did not present with accompanying tinnitus or dizziness, except for one patient. Patient III-3 was a 41-year-old woman with non-specific intermittent dizziness and tinnitus. A hopeful aspect for patients with HHL with this pattern (late-onset progressive HL, post-lingual deafness) is that they experience appropriate linguistic development and will have better results after CI [8]. They will also have a longer time window for some interventions such as drugs or gene therapies, which are currently under rapid development [9]. Through WES screening and confirmation by Sanger sequencing, we detected a gene that had not previously been reported as related to hearing: HAS1. In silico analyses predicted that the missense point variant observed in this family may damage HAS1 function and might lead to disease.
We classified the current variant (c.1082G>A; p.Cys361Tyr) according to ACMG/AMP guideline [10]. The PS4, PM2, PM6, PP2, and PP3 categories were feasible, leading to a categorization of “likely pathogenic.” We also applied the ACMG criteria with the HL-EP specification [11]: the findings of PM2, PP1_strong, and PP3 also collectively indicated that this variant is “likely pathogenic.” Hyaluronic acid, otherwise called hyaluronan, is an anionic non-sulfated glycosaminoglycan that composes the extracellular matrix in epithelial, cartilage, connective, and neural tissue [12,13]. Hyaluronan plays important roles in cell migration, proliferation, and differentiation through hyaluronan receptors such as CD44 or receptor for HA-mediated motility (RHAMM) [14-17], and studies have also reported that it can affect the progression of some tumors [18,19]. This molecule is synthesized in the inner surface of the plasma membrane by HAS, and one-third of the hyaluronan in the body is degraded and resynthesized every day [20]. In mammals, three HAS genes have been identified, showing 55%–71% sequence identity: HAS1, HAS2, and HAS3 [21-25]. Although HAS isoforms bear high homology in their amino acid sequences, they are all located in different chromosomes [26] and show different enzymatic activity; HAS1 requires a higher concentration of its substrate, uridine diphosphate N-acetylglucosamine (UDP-GlcNAc) [4,27]. The expression level of HAS1 is relatively low in many cell lines [28-31]. In mouse KO models, Has2 seems to be the most important for general embryonic development, since Has2 KO mice die at mid-gestation [32] whereas Has1 or Has3 KO mice are viable [33,34]. Although the role of HAS1 has been described in several tumors such as multiple myeloma, bladder cancer, and breast cancer [35-37], it has not yet been studied in the auditory system.
In our study, Has1 expression was detected as early as E10.5 in the otocyst of mice and remained present throughout embryonic auditory development. It was localized in the most apical part of luminal cells. Later stages showed that this protein was localized in the SV, hair cells, and supporting cells in the greater and lesser epithelial ridges. In the neonatal stage, Has1 expression was detected in the SV and organ of Corti hair cells, supporting cells, and some spiral ganglion cells. In adult mice, Has1 was mainly expressed in SV marginal cells, suggesting that its role in hearing could be related to these cells.
We obtained functional hearing thresholds from the IMPC (www.mousephenotype.org). This database provided ABR data for 14-week-old Has1 KO mice (considered young adult animals), according to IMPC protocols. The click ABR data indicated that overall hearing was similar between the Has1 knockout and WT control animals. However, male mice showed hearing loss at low frequencies (6, 12, and 18 kHz). The hearing thresholds of female mice were similar to those of control animals. The reason for this male penetrance is still elusive. Moreover, in the family with HHL analyzed in this study, both men and women were affected and their hearing showed delayed progressive deterioration until middle age (age 40). A limitation of the IMPC ABR data is that there were only four HAS1 KO mice (two males and two females) compared to 458 controls (228 males and 230 females). More thorough evaluations, such as with a large number of mice, hearing tests at older ages, or susceptibility to ototoxicity, seem to be needed in these mouse models.
Thus far, the role of HAS1 in the normal auditory system or how its genetic variant causes hearing loss is not yet clear. Since our cases of HHL showed progressive hearing deterioration after adolescence, HAS1 expression at this stage seems to be important for investigating the function of this protein in the auditory system. In mice, Has1 was especially well-expressed in the membrane of SV marginal cells after birth, suggesting a role in ion homeostasis or cochlear metabolism. The mechanism through which the p.Cys361Tyr variant can affect HAS1 functions needs to be elucidated. This variant is located in the glycosyltransferase-like family 2 domain, and it therefore might have affected the enzymatic activity. Since HAS1 is a membrane-bound protein, the variant form might have reduced binding stability. However, gnomAD reported several variants of HAS1 without apparent phenotypes. For example, a stop gain variant (p.Ser363Ter, variant ID: 19-52217329-G-A), containing two amino acids different from that of the variant detected in the present study, has been reported in a healthy woman—albeit without a thorough presentation of her hearing levels. The effect of a truncated form versus a point variant form needs to be studied.
In conclusion, a point variant (c.1082G>A; p.Cys361Tyr) in Has1 was observed in a family with non-syndromic late-onset progressive hearing loss with an autosomal dominant pattern. In mice, Has1 is expressed in the otocyst during embryonic development and its strongest expression occurs in SV marginal cells in the adult stage. The precise role of HAS1 in the vestibulocochlear organ needs further investigation, such as through a KO mice study. HAS1 may be related to human HHL and is a candidate gene for future HHL genetic testing.
HIGHLIGHTS
▪ A point variant (c.1082G>A; p.Cys361Tyr) in HAS1 was observed in non-syndromic late-onset progressive hearing loss in an autosomal dominant pattern.
▪ HAS1 is expressed in the otocyst during embryonic development, and its strongest expression occurs in stria vascularis marginal cells in the adult stage.
▪ HAS1 may be related to human hereditary hearing loss (HHL) and is a candidate gene for future HHL genetic testing.
Notes
No potential conflict of interest relevant to this article was reported.
Acknowledgements
This research was supported by a Basic Science Research Program grant (NRF-2014R1A1A2054755) through the National Research Foundation of Korea (NRF), funded by the Ministry of Education, Science, and Technology. It was also supported by a grant of the Korea Health Technology R&D Project through the Korea Health Industry Development Institute (KHIDI), funded by the Ministry of Health & Welfare, Republic of Korea (HR20C0021) and Chonnam National University Hospital Biomedical Research Institute grant (No. CRI16029-1).
Notes
AUTHOR CONTRIBUTIONS
Conceptualization: HHC, SL. Data curation: AU, CJL, YC, TK. Formal analysis: SL, TK. Funding acquisition: HHC. Methodology: AU, CJL, YC, TK. Project administration: HHC, SL. Validation: AU. Visualization: AU, SL. Writing–original draft: AU, SL. Writing–review & editing: SL, HHC.
Supplementary Materials
Supplementary materials can be found via https://doi.org/10.21053/ceo.2022.00038.
Candidate gene list obtained through whole-exome sequencing
(A, B) Expression of Has2 and Has3 during embryonic development. Unlike Has1, Has2 and Has3 were not expressed at the E14.5 or E16.5 embryonic stages. DAPI, 4′,6-diamidino-2-phenylindole. Scale bar: 100 μm.
Has1 expression in the adult vestibular organ. Section image from a 6-week old adult mouse. (A) Has1 was expressed in the saccule. Note that some vessels also expressed Has1 in the modiolus. (B) Magnified image of the box in (A). Saccular hair cells robustly expressed Has1. DAPI, 4′,6-diamidino-2-phenylindole. Scale bar: 100 μm.
