Induction of the BRAFV600E Mutation in Thyroid Cells Leads to Frequent Hypermethylation
Article information

Abstract
Objectives.
The BRAFV600E mutation is a major driver mutation in papillary thyroid cancer. The aim of this study was to elucidate the correlation between DNA methylation and gene expression changes induced by the BRAFV600E mutation in thyroid cells.
Methods.
We used Nthy/BRAF cell lines generated by transfection of Nthy/ori cells with the wild-type BRAF gene (Nthy/WT cells) and the V600E mutant-type BRAF gene (Nthy/V600E cells). We performed gene expression microarray and DNA methylation array analyses for Nthy/WT and Nthy/V600E cells. Two types of array data were integrated to identify inverse correlations between methylation and gene expression. The results were verified in silico using data from The Cancer Genome Atlas (TCGA) and in vivo through pyrosequencing and quantitative real-time polymerase chain reaction (qRT-PCR).
Results.
In the Nthy/V600E cells, 199,821 probes were significantly hypermethylated, and 697 genes showed a “hypermethylation-downregulation” pattern in Nthy/V600E. Tumor suppressor genes and apoptosis-related genes were included. In total, 66,446 probes were significantly hypomethylated, and 227 genes showed a “hypomethylation-upregulation” pattern in Nthy/V600E cells. Protooncogenes and developmental protein-coding genes were included. In the TCGA analysis, 491/697 (70.44%) genes showed a hypermethylation-downregulation pattern, and 153/227 (67.40%) genes showed a hypomethylation-upregulation pattern. Ten selected genes showed a similar methylation-gene expression pattern in pyrosequencing and qRT-PCR.
Conclusion.
Induction of the BRAFV600E mutation in thyroid cells led to frequent hypermethylation. Anticancer genes, such as those involved in tumor suppression or apoptosis, were downregulated by upstream hypermethylation, whereas carcinogenic genes, such as protooncogenes, were upregulated by hypomethylation. Our results suggest that the BRAFV600E mutation in thyroid cells modulates DNA methylation and results in cancer-related gene expression.
INTRODUCTION
Thyroid cancer is one of the most common solid organ cancers, and its incidence has increased dramatically in the last decade [1,2]. Papillary thyroid carcinoma (PTC) is the most common histologic subtype and is associated with the BRAFV600E somatic mutation, which is known to be associated with poor prognostic factors such as lymph node metastasis, extrathyroidal extension, and advanced stage [3,4]. The BRAFV600E mutation is the highest signal activator of the mitogen-associated protein kinase (MAPK)/ extracellular signal-regulated kinase (ERK) pathway. It activates a carcinogenic signal cascade in thyroid cells and makes them more proliferative [3]. Recent whole-genome sequencing performed by The Cancer Genome Atlas (TCGA) project further revealed that BRAFV600E mutant-type PTC showed significant upregulation of the pERK-DUSP (Erk transcriptional program) pathway, possibly due to the insensitivity of BRAFV600E to ERK inhibition feedback [5].
The molecular mechanism of gene expression alterations resulting from the BRAFV600E driver mutation is not yet fully understood. Beyond genomic transcription, epigenomic changes, such as DNA methylation, or microRNAs can act as important factors that modulate gene expression [6]. DNA hypermethylation or hypomethylation in CpG islands can downregulate or upregulate downstream gene expression [7]. In thyroid cancer, some laboratory studies have suggested that specific aberrant DNA methylation is found in cancer-related genes such as PTEN and RASSF1A [6,8]. Previous studies have reported genomewide integrated analyses of methylation and expression arrays and the sequencing of thyroid cancer tissue or thyroid cancer cell lines [9-15]. However, previous studies could not determine the actual consequences of the primitive BRAFV600E mutation because the cell lines used in previous studies closely resembled dedifferentiated thyroid cancers, such as anaplastic thyroid cancer, rather than the precancerous state [16].
Our aim in this study was to investigate changes in DNA methylation and gene expression in thyroid cells initiated by the primitive BRAFV600E mutation. We used the Nthy/BRAF cell line, which was generated by transfection of either wild-type BRAF (Nthy/WT) or mutant BRAF (Nthy/V600E) into Nthy/ori cells at the authors’ institution [17]. We performed gene expression and methylation microarray analyses and analyzed two types of data to find correlations between DNA methylation and gene expression induced by the BRAFV600E mutation in normal thyroid cells.
MATERIALS AND METHODS
Nthy/BRAF cell line and gene expression microarray
We previously reported Nthy/ori cell lines expressing the BRAF gene with or without V600E mutation [17]. Two types of Nthy/BRAF cells were presented: Nthy/WT (Nthy cells with wild-type BRAF gene) and Nthy/V600E (Nthy cells with V600E mutanttype BRAF gene). Cells were grown in RPMI-1640 (Biowest, Riverside, MO, USA) supplemented with 10% FBS (Biowest), 2 mM GlutaMAX (Gibco; Thermo Fisher Scientific, Waltham, MA, USA), and 100 U/mL penicillin-streptomycin (Gibco) in a humidified atmosphere of 5% CO2 at 37°C. They were cultured in 100-mm dishes until confluent monolayers were reached, and RNA was extracted using an easy-spin total RNA extraction kit (iNtRON Biotechnology, Seoul, Korea). Total RNA was quantified using a Nanodrop ND-1000 spectrophotometer. The Illumina HumanHT-12 v4 Expression Bead Chip (Illumina Inc., San Diego, CA, USA) microarray services were provided by Macrogen (Macrogen Inc., Seoul, Korea). Two arrays were conducted for each cell type (2xNthy/WT and 2xNthy/V600E).
Methylation microarray
For DNA extraction, Nthy/WT and Nthy/V600E cells were cultured until a confluent monolayer was formed. Cells were harvested by trypsin-EDTA treatment, and DNA was extracted using QIAamp DNA Mini Kit (Qiagen, Hilden, Germany). DNA concentration was quantified using a spectrophotometer (NanoDrop, Wilmington, DE, USA). After DNA extraction, methylation microarray services were provided by Macrogen (Macrogen Inc., Seoul, Korea) using Illumina Infinium Methylation EPIC Bead Chip Kits (850K; Illumina Inc., San Diego, CA, USA). Three arrays were conducted for each cell type (3xNthy/WT and 3xNthy/V600E).
Bioinformatic analysis
Microarray data were analyzed according to two groups: Nthy/WT and Nthy/V600E. Detailed methods for gene expression microarray analysis are described elsewhere [17]. To identify differentially expressed genes (DEGs), a moderated t-test using “limma” package was applied [18]. Benjamini-Hochberg method was applied to correct the false positive rate from multiple comparisons. A log fold change of 2.0 was used as the cutoff value for significant DEGs.
Methylation array data were analyzed by “ChAMP” package provided by Bioconductor [19]. To identify differentially methylated probes (DMPs), “limma” method was also applied [18]. False positive rate correction was performed with the Benjamini-Hochberg test. Adjusted P-value under 0.05 was considered statistically significant for both gene expression and methylation analysis. Genes with inverse methylation-expression patterns were identified according to the following criteria: differentially hypermethylated probes in the promoter region with downregulated gene expression or promoter region hypomethylation with upregulated gene expression (Fig. 1). The promoter region was defined as CpG islands in TSS1500, TSS200, the 5´-untranslated region (UTR) and the 1st exon area.
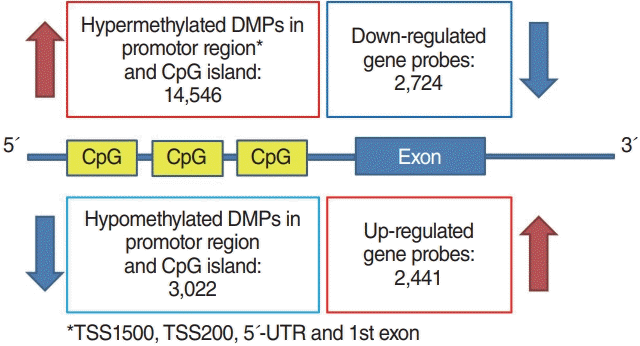
Schematic diagram of the correlation analysis between differentially methylated probes (DMPs) in promoters and differentially expressed genes in exons. UTR, untranslated region.
To find functional terms of inversely correlated genes, Database for Annotation, Visualization, and Integrated Discovery (DAVID 6.7) and Swiss-Prot Protein Information Resource (SPPIR) were used. Adjusted P-value less than 0.1 was considered statistically significant. All statistical analyses were performed with the R programming language (https://www.R-project.org/).
Validation of inverse correlations using a dataset from TCGA
To validate genes with inverse correlation patterns using other public databases, we assessed somatic mutations, mRNA expression by RNA sequencing and DNA methylation by Illumina Infinium Methylation 450K from the TCGA data (https://gdc.cancer.gov/). Patients in the TCGA cohort were divided into two groups according to BRAF mutation status. For the inversely correlated genes derived from the microarray analysis, we checked mRNA expression and promoter site methylation patterns between BRAF wild-type PTC versus BRAF mutant-type PTC. If the same hypermethylation-downregulation or hypomethylation-upregulation pattern was observed, it was marked as “TRUE”; otherwise, it was marked as “FALSE.”
Validation of gene expression by quantitative real-time polymerase chain reaction
Cells were cultured in 100-mm dishes until confluent monolayers were formed, and total RNA was extracted using RNeasy Mini Kit (Qiagen) and quantified using Nanodrop One (Thermo Fisher). cDNA was transcribed from 1 µg of RNA using Legene Premium Express 1st strand DNA Synthesis System Kit (LeGene Biosciences, San Diego, CA, USA). Quantitative real-time polymerase chain reaction (qRT-PCR) was performed using PowerTrack SYBR green master mix (Applied Biosystems, Waltham, MA, USA) and a QuantStudio 3 real-time PCR System (Applied Biosystems); all samples were run on the same 96-well plate. Relative mRNA expression levels were calculated by normalizing the value for each gene to that of the housekeeping gene ACTB (beta-actin). The primer sequences for qRT-PCR are described in Supplementary Table 1.
Validation of promoter methylation status by pyrosequencing
Nthy/WT and Nthy/V600E cells were cultured until confluent monolayers were formed. Genomic DNA was extracted using QIAamp DNA mini kit (Qiagen) according to manufacturer’s recommendations. The genomic DNA (gDNA) concentration was quantified using a Nanodrop One (Thermo Fisher), and >1 µg/20 µL of gDNA was provided for pyrosequencing analysis. Pyrosequencing was performed by Macrogen (Seoul, Korea) using PyroMark Q48 Autoptrep (Qiagen) system. Primers for pyrosequencing are described in Supplementary Table 2. EpiTect Fast DNA Bisulfite Kit (QIAGEN) was used for bisulfite treatment. The methylation rate was compared between the two types of pyrosequencing data before and after bisulfite treatment. For plotting the pyrosequencing and qRT-PCR validation results, GraphPad Prism ver. 9.1.0 for Windows (GraphPad, San Diego, CA, USA) was used.
Ethical statement
This is not the study that deals with human or animal subjects, so it doesn’t need to gain the approval from Institutional Review Board/Institutional Animal Care and Use Committee (IACUC).
RESULTS
In total, 5,165 genes were differentially expressed between Nthy/WT and Nthy/BRAF cells; 2,441 DEGs were upregulated and 2,724 DEGs were downregulated in Nthy/V600E cells (Fig. 1) [17]. In the methylation array analysis, 266,267 probes were differentially methylated between the Nthy/WT and Nthy/V600E cells. The detailed number of DMPs according to the genomic structure and geographic region of the CpG island is shown in Fig. 2. In Nthy/V600E cells, 199,821 probes were hypermethylated and 66,446 probes were hypomethylated (Fig. 1).
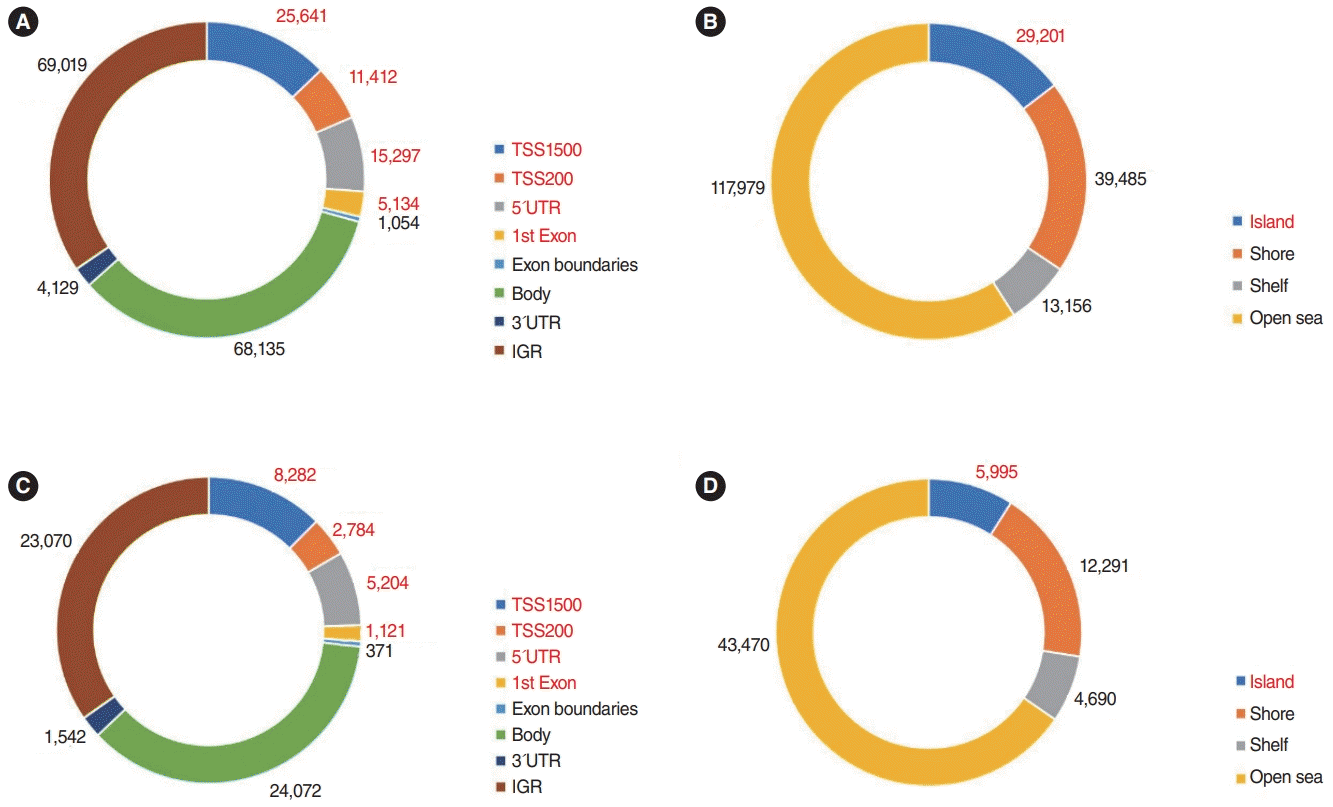
Distribution of differentially methylated probes according to genomic location and CpG site. (A) Number of hypermethylated probes in Nthy/V600E cells; genomic structure. (B) Number of hypermethylated probes in Nthy/V600E cells; geographic regions from the CpG area. (C) Number of hypomethylated probes in Nthy/V600E cells; genomic structure. (D) Number of hypomethylated probes in Nthy/V600E cells; geographic regions from the CpG area. UTR, untranslated region; IGR, intergenic region.
Nthy/V600E cells showed 14,516 hypermethylated DMPs in the promoter region with CpG islands. There were 2,724 significantly downregulated genes in Nthy/V600E cells. According to genomic location, 697 genes showed an inverse correlation pattern (promoter hypermethylation with exonic downregulation) in Nthy/V600E cells (Supplementary Table 3). Table 1 lists the top 20 genes that showed promoter hypermethylation and gene downregulation, sorted by the number of hypermethylated probes of CpG islands in the promoter region. Apoptosis-related genes (FASKT, PTEN, EPB41L3), structural constituent-related genes (FBLN2), DNA repair genes (MAD2L2), and scavenger receptor genes (SCARF2) were included.
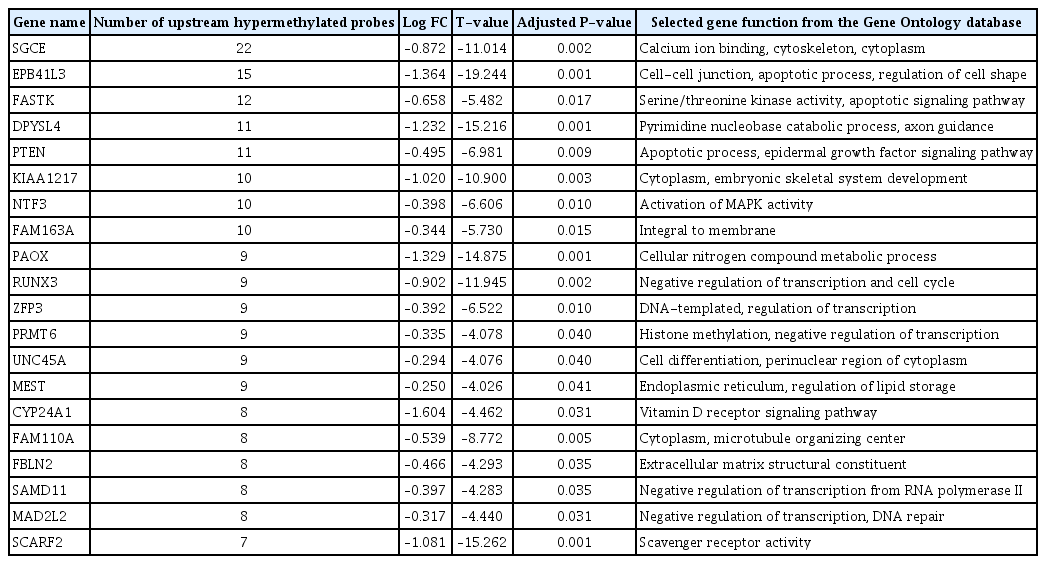
Top 20 genes with DNA hypermethylation above the exonic area and downregulation of exons in Nthy/V600E cells
Conversely, the number of hypomethylated DMPs in the promoter region in Nthy/V600E cells was 3,022, and 2,441 genes were significantly upregulated. Furthermore, 227 genes had an inverse correlation pattern of promoter hypomethylation and exon upregulation in Nthy/V600E cells (Supplementary Table 4). Table 2 shows the top 20 genes that have DNA hypomethylation and exon upregulation in Nthy/V600E cells. Cell cycle-related genes (CCND1, BCL2, PSMD5), MAPK activation-related genes (GHR), and transmembrane transporter-related genes (SLC6A15, BCL2, HOXB7, NPAS2, KCNK1, ARHGAP22) were included.

Top 20 genes that had an inverse correlation with hypomethylation and upregulation in Nthy/V600E cells
SP-PIR keywords obtained from 697 hypermethylated-downregulated genes in Nthy/V600E are listed in Table 3. Tumor suppressor genes (RASSF4, PRR5, PLA2G16, CADM1, EFNA1, PYCARD, BIN1, MN1, PTEN, and MTUS1) were downregulated in response to upstream hypermethylation in Nthy/V600E cells. Table 4 lists the SP-PIR terms corresponding to the 227 hypomethylated-upregulated genes in Nthy/V600E cells. Protooncogenes (EGFR, FGF5, CCND1, FLI1, MAFB, BCL2, ETV1, FOXO1, MECOM, CBFB) were upregulated in response to upstream hypomethylation in Nthy/V600E cells. In silico validation using TCGA data showed that 491 of 697 genes (70.44%) presented the same promoter hypermethylation with a gene downregulation pattern in PTC with the BRAFV600E mutation tissue compared with PTC tissue without the BRAFV600E mutation. Furthermore, 153 of 227 genes (67.40%) showed hypomethylation with a gene upregulation pattern in PTC with the BRAFV600E mutation. Details of the TCGA validation results for 924 genes are described in Supplementary Table 5.
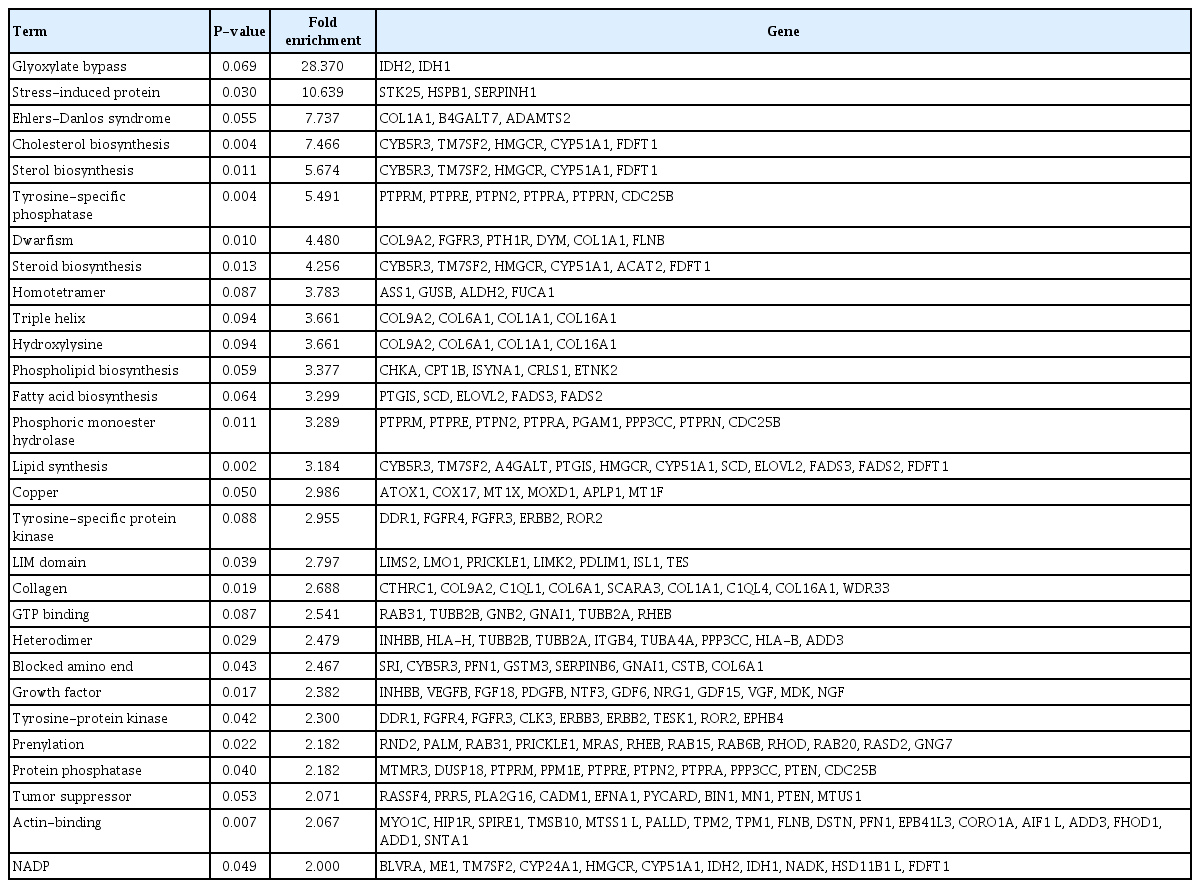
SP-PIR keywords obtained from 697 hypermethylated-downregulated genes in Nthy/V600E cells
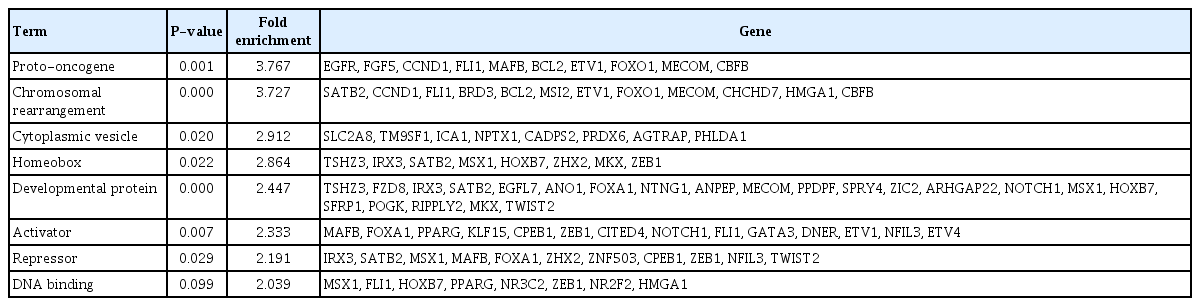
SP-PIR keywords from 227 hypomethylated-upregulated genes in Nthy/V600E cells
Fig. 3 shows the in vitro validation results for some inversely correlated genes (RUNX3, MEST, TP53INP1, RASSF4, and GPX3 among the hypermethylated genes with downregulation in Nthy/V600E cells; CCND1, BCL2, DUSP6, EGFR, and ZEB1 among the hypomethylated genes with upregulation in Nthy/V600E cells). Pyrosequencing was used for the methylation analysis, and qRT-PCR was used for mRNA expression analysis. RUNX3, MEST, TP53INP1, RASSF4, and GPX3 showed higher promoter methylation rates in Nthy/V600E cells than in control cells (Fig. 3A). RUNX3, MEST, RASSF4, and GPX3 also showed lower mRNA expression in Nthy/V600E cells (Fig. 3B). CCND1, BCL2, DUSP6, EGFR, and ZEB1 showed lower promoter methylation rates in Nthy/V600E cells, and these genes showed higher mRNA expression in Nthy/V600E cells (Fig. 3C and D).
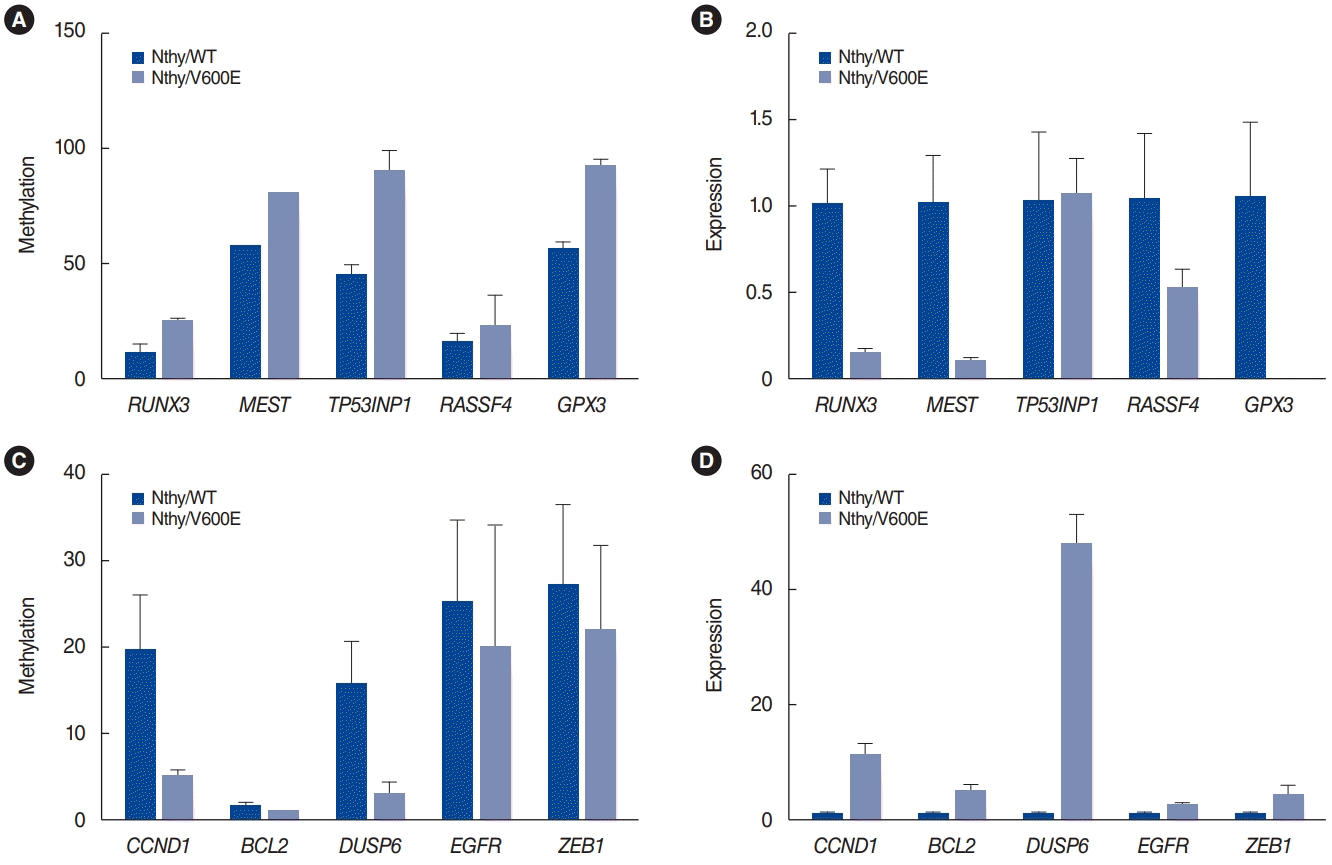
Pyrosequencing and quantitative real-time polymerase chain reaction results for selected genes. (A) Methylation status of selected genes that showed hypermethylation and downregulation in Nthy/V600E cells. (B) mRNA expression status of selected genes that showed hypermethylation and downregulation in Nthy/V600E cells. (C) Methylation status of selected genes that showed hypomethylation and upregulation in Nthy/V600E cells. (D) mRNA expression status of selected genes that showed hypomethylation and upregulation in Nthy/V600E cells. Nthy/WT, Nthy/ori cells with the wild-type BRAF gene; Nthy/V600E, V600E mutant-type BRAF gene.
DISCUSSION
The somatic BRAFV600E mutation is a major driver mutation in thyroid cancer, particularly in differentiated PTC. The prevalence of the BRAFV600E mutation in thyroid cancer has been reported to be up to 30%–80%, and it is known to be associated with aggressive characteristics of thyroid cancer [3,20]. The basic molecular mechanism of the BRAFV600E mutation in thyroid cancer is activation of the MAPK/ERK pathway. The activation of MAPK-related gene expression in cells is considered to be a major tumorigenic mechanism of various cancers associated with enhanced cell cycle progression, uncontrolled division, and overproliferation [21,22].
Concurrent genomic and epigenomic changes initiated by the BRAFV600E mutation in thyroid cancer have been specifically demonstrated in previous research. Gene expression and DNA methylation changes in MAPK pathway genes are associated with specific clinicopathologic characteristics of thyroid cancer [10,23]. The TCGA project and other next-generation sequencing studies have also revealed that specific sets of gene expression alteration patterns are present in thyroid cancer, followed by the BRAFV600E mutation [5,24]. According to TCGA, BRAFV600E-like thyroid cancer involves upregulated ERK-related genes, including DUSP, which initiates Erk transcription and indicates a low thyroid differentiation score. The methylation signature was also different between BRAF-type and RAS-type thyroid cancers [5]. However, the intracellular mechanism by which the BRAFV600E driver mutation alters the expression of various genes in thyroid cells has not yet been clearly elucidated. A TCGA analysis showed two DNA methylation clusters in BRAFV600E-like thyroid cancer, but the molecular consequences of CpG methylation and gene expression changes were not evaluated [5].
DNA methylation is an epigenomic phenomenon in which a methyl group is attached to the fifth carbon of the cytosine residue in CpG dinucleotides. Clusters of CpG dinucleotides are called CpG islands and are generally located in promoter regions. Hypermethylation of promoter CpG islands represses the transcription of downstream exons and results in suppressed gene expression [7,25]. Hou et al. initially proposed that the BRAFV600E mutation may alter MAPK gene expression through DNA methylation [14]. They reported a functional association of the BRAFV600E mutation with methylation changes in thyroid cancer cells and suggested that the BRAFV600E mutation could facilitate epigenetic changes. They used the BCPAP and OCUT1 cell lines, which harbor the BRAFV600E mutation [14]. In the control group, they used the shRNA method to knock down the BRAF gene in the thyroid cancer cell lines. Studies have demonstrated a correlation between DNA methylation and gene expression in thyroid cancer according to BRAFV600E mutation status using patient-derived PTC tissue and normal thyroid tissue as controls [10,12,26-28]. These studies found that hypermethylation of tumor suppressor genes (PTEN, RASSF1A, TIMP3, SLC5A8, DAPK, RARβ2, etc.) and hypomethylation of oncogenes (VEGF, etc.) were identified in thyroid cancer with the BRAFV600E mutation. However, previous studies used thyroid cancer cells that had already differentiated into cancer rather than cells that were in the precancerous state or continuously differentiated from normal cells. Thus, those studies could not determine the order of the consequences of the primitive BRAFV600E mutation at the genomic, methylation, and expression levels. In particular, those studies were not able to clarify whether mutation or methylation came first. Although Hou et al. used BRAF knockdown PTC cell lines, they were still not representative of the initial period of carcinogenesis induced by the BRAFV600E mutation. As such, previous studies have limitations in explaining the cellular epigenomic and genomic consequences of the BRAFV600E mutation.
To overcome the abovementioned limitation, we used our BRAF gene-transfected Nthy/ori cell lines (Nthy/WT and Nthy/V600E) [17]. In our initial research, Nthy/WT cells showed similar biological behavior to Nthy/ori cells. In contrast, Nthy/V600E cells showed increased anchorage-independent growth and invasion ability and upregulated genes with the ERK/MAPK cascade over time, gradually becoming thyroid cancer cells. We suggest that Nthy/V600E cells are a good model to study early-stage biological consequences induced by the BRAFV600E mutation in thyroid cells. Therefore, we can safely conclude that the methylation changes in our study are processes that follow the initial BRAF mutation.
Our research showed that induction of the BRAFV600E mutation in Nthy/ori cells resulted in frequent DNA hypermethylation; 199,821 probes were hypermethylated in Nthy/V600E cells, while 66,446 probes were hypermethylated in Nthy/WT cells. In the correlation analysis between methylation and gene expression, 697 genes were hypermethylated and downregulated in Nthy/V600E cells. These genes included FASTK, a strong inducer of apoptosis and the immune response; PTEN, a tumor suppressor gene in many cancers; SGCE, whose expression is significantly increased by CpG methylation in gastric cancer; PAOX, whose inhibition results in the rapid death of progenitor cells; MEST, whose loss of expression with methylation is related to carcinogenesis; and RUNX3, whose site-specific hypermethylation predicts PTC recurrence. In the protein information analysis, tumor suppressor genes that repress carcinogenesis were also downregulated in Nthy/V600E cells. In contrast, 227 genes were hypomethylated and overexpressed in Nthy/V600E cells. The functions of these genes were related to transporting glucose and other sugars and hypermethylation in cancer (SLC6A15), blocking apoptotic death and differential methylation in breast cancer (BCL2), and altering cell cycle progression and contributing to tumorigenesis and hypomethylated-high gene expression (CCND1). Protooncogenes that promote carcinogenesis were significantly enriched in the protein information analysis.
We selected 10 genes for validation analysis as follows: RUNX3, MEST, TP53INP1, RASSF4, GPX3, CCND1, BCL2, DUSP6, EGFR, and ZEB1. RUNX is a tumor suppressor gene, whose methylation in thyroid cancer can predict the recurrence of PTC. DNA methylation following MEST gene expression knockdown has been proposed to facilitate thyroid cancer cell survival. For TP53IP1, loss of p53 function is important for immortalization in thyroid cancer cell lines. Methylation of Ras association domain family (RASSF) genes was reported in thyroid cancer. GPX3 is frequently methylated in human PTC tissue, and its expression is associated with tumor size and lymph node metastasis. Enhanced CCND1 gene expression has been proposed as a prognostic factor and possible mechanism for recurrence in PTC. Higher expression of the BCL2 gene was associated with poor survival in thyroid cancer. Increased expression of the DUSP6 gene with decreased DNA methylation was reported in PTC. Overexpression of EGFR in thyroid cancer is well known and associated with tumor aggressiveness and progression. Overexpression of ZEB1 was associated with aggressive tumor progression of PTC. For those genes, the same methylation alteration patterns were obtained in promoter sites by pyrosequencing, and inverse correlations of mRNA expression were also identified, as shown in Fig. 3. Therefore, we propose that our results for inversely correlated genes from our microarrays are reliable, as the important genes were validated by pyrosequencing and qRT-PCR (Fig. 3).
We checked the methylation and gene expression changes of significant genes in the TGCA data, part of in silico validation. We identified that 491 of 697 genes (70.44%) showed the same hypermethylation-downregulation pattern, and 153 of 227 genes (67.40%) showed hypomethylation-upregulation in BRAFV600E mutated PTC tissue (Supplementary Table 5). The remaining 30% of genes did not show significant methylation-gene expression changes. This difference is probably because one experiment was performed on cell lines and another experiment was performed on surgically removed cancer tissue. Although the cancer cell line has very similar properties to those of the cancer tissue from which it originated, it is inevitably genetically different from cancer tissue growing in the human body as a result of being grown in an in vitro environment. Therefore, three-dimensional cell line models such as organoids are being used in recent studies. We suggest that future research should investigate these issues using three-dimensional cell lines.
Based on our analysis, we suggest that initiation of the BRAFV600E mutation in thyroid cells can modulate cancer-related gene expression by altering promoter site CpG island methylation. The possible carcinogenic mechanism is illustrated in Fig. 4. There have been many reports of methylation changes caused by BRAF mutations in various cancers. However, there has been relatively little research on the mechanism through which the BRAF mutation directly and indirectly affects DNA methylation. One study suggested that the BRAF mutation results in the deregulation of the TET genes (TET1, TET2, and TET3), which encode DNA demethylases, leading to demethylation in colon cancer [29]. Another report suggested that the BRAF oncoprotein activates the transcriptional repressor MAFG to mediate CpG island methylation [30].
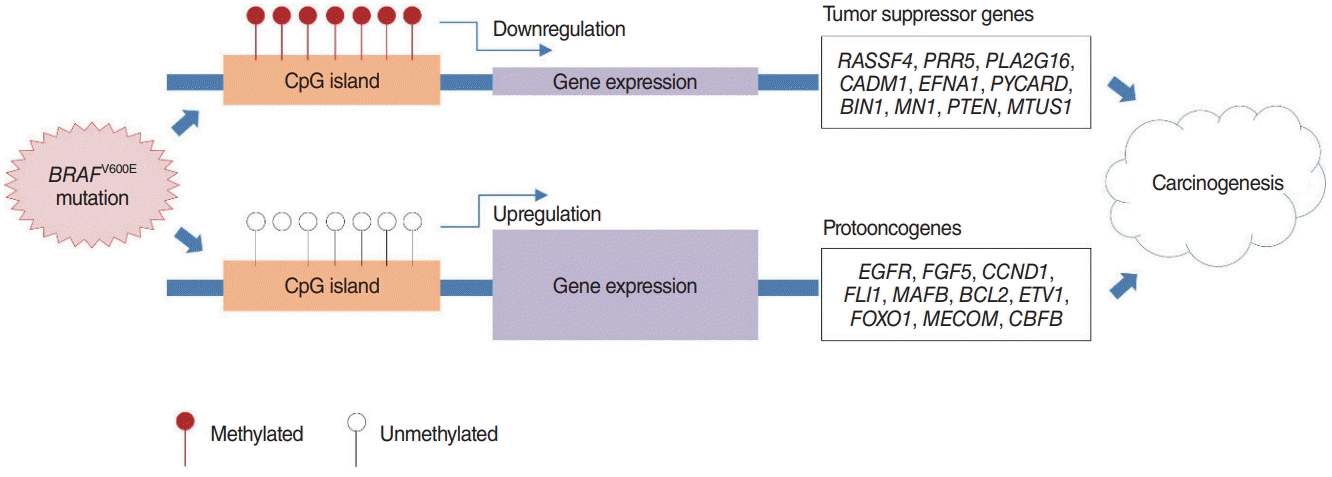
Possible carcinogenic mechanisms of the BRAFV600E mutation.
The BRAFV600E mutation suppresses antitumor-related gene expression by promoting hypermethylation, but it enhances the expression of genes with tumorigenic effects by hypomethylation. In particular, our findings strongly support this argument, unlike previous research, as we experimented with both gene expression and methylation arrays in normal thyroid cells with cancer progression induced by the BRAFV600E driver mutation, which is the highest trigger in the MAPK pathway. This study is also the first report that used the latest methylation array chip, Infinium MethylationEPIC BeadChip (850k) in a thyroid cancer study. Using this higher-density chip, we were also able to perform a more detailed analysis of promoter site methylation than previous studies that used 27K or 450K chips [10,27,28].
The results of our study are suggested to have the following clinical implications. If a test method using a DNA methylation biomarker related to the BRAF mutation is developed and applied in the clinical field, the diagnostic accuracy for ambiguous thyroid nodules could be improved. Thus, unnecessary re-testing or diagnostic surgery could be reduced. In addition, the BRAF mutation is expected to be used as a biomarker to determine the prognosis and future treatment policies for patients undergoing surgery for thyroid cancer. Finally, since methylation changes are epigenetic, meaning that they are easier to modify than DNA mutations or gene expression alterations, there may be the potential to develop a methylation-targeted therapeutic agent to control CpG islands located on carcinogenic genes.
This study has certain limitations. Although our cell lines are good models for studying the genomic consequences of the BRAFV600E mutation, they are not yet standardized worldwide. Further studies including previously known BRAF mutationdominant or RAS mutation-dominant thyroid cancer cell lines are needed to support our results [16]. In addition, our study could not conclude that methylation changes due to BRAF gene mutations can be reversed by BRAF gene suppression (e.g., with BRAF inhibitor treatment). Finally, in our study, we did not identify the direct mechanisms of how the BRAF mutation affects methylation in thyroid cancer cell lines, because our study dealt with associations using two types of microarrays. We intend to address these limitations in our subsequent research.
In summary, induction of the BRAFV600E mutation in normal thyroid cells changed gene expression by affecting the frequency of DNA methylation of promoter site CpG islands. This result suggests that the BRAFV600E mutation modulates DNA methylation to change gene expression in the carcinogenic cascade. In future research, this result will be used to identify potential diagnostic and therapeutic targets in thyroid cancer.
HIGHLIGHTS
▪ Induction of the BRAFV600E mutation in thyroid cells led to frequent hypermethylation, which was associated with the downregulation of anticancer genes, such as those involved in tumor suppression and apoptosis.
▪ Carcinogenic genes, such as protooncogenes, were upregulated by hypomethylation.
▪ Our results suggest that the BRAFV600E mutation in thyroid cells modulates DNA methylation and results in cancer-related gene expression.
Notes
No potential conflict of interest relevant to this article was reported.
AUTHOR CONTRIBUTIONS
Conceptualization: SJK, KEL. Data curation: JWY, SYH, KK, SJK, YJC, JYC. Formal analysis: JWY, KK. Funding acquisition: JWY, SJK. Methodology: YJC, JYC, KEL. Project administration: KEL. Visualization: JWY. Writing–original draft: JWY, SYH, KEL. Writing–review & editing: all authors.
Acknowledgements
This study was funded by research grant from Seoul National University Hospital (no. 04-2013-0770), research grants from Inha University Hospital and College of Medicine, and National Research Foundation of Korea (NRF) grant funded by the Korean government (MSIT) (No. NRF-2021R1G1A1091596).
Supplementary Materials
Supplementary materials can be found via https://doi.org/10.21053/ceo.2022.00206.
Sequences of primers used for quantitative real-time polymerase chain reaction (qRT-PCR)
Primer design for pyrosequencing
Genes that had inverse correlations with hypermethylated downregulated genes in Nthy/V600E cells
Genes that had inverse correlations with hypomethylated upregulated genes in Nthy/V600E cells
Validation of the inverse correlation patterns of 924 genes in Nthy/V600E cells and The Cancer Genome Atlas papillary thyroid carcinoma (TCGA PTC) tissue with the BRAF mutation