The Expression of Defensin-Associated Genes May Be Correlated With Lymph Node Metastasis of Early-Stage Tongue Cancer
Article information

Abstract
Objectives.
We aimed to assess the genetic differences between cases of early-stage tongue cancer that were positive or negative for lymph node metastasis.
Methods.
In total, 35 cases of tongue cancer with RNA sequencing data were enrolled in this study. The gene expression profile of the following two groups was compared: N0 group (T stage 1 or 2 with N0 stage) and N+ group (T stage 1 or 2 with N+ stage). Using the R and limma packages in the Bioconductor program, we extracted the differentially expressed genes (DEGs). Gene ontology and pathway enrichment analysis were performed using the Database for Annotation, Visualization and Integration Discovery (DAVID) online tool. Immune cell infiltration was analyzed using the CIBERSORT online program. Immunochemical staining of the cancer tissue was evaluated and The Cancer Genome Atlas (TCGA) data were analyzed to validate the identified DEGs.
Results.
No significant differences were found in the infiltration of 22 types of immune cells. Among a total of 51 identified DEGs, 14 genes were significantly upregulated, while 37 genes were significantly downregulated (P<0.01; fold change >2). Pathway analysis revealed significant associations with the arachidonic acid metabolism-related pathway, calcium signaling, and the muscle contraction pathway. The following DEGs were the most significantly different between the two groups: DEFB4A, SPRR2B, DEFB103B, SPRR2G, DEFB4B, and FAM25A. TCGA data showed that DEFB4A and DEFB103B were more highly expressed in the N0 group than in the N+ group, although the difference did not achieve statistical significance. Immunochemical staining of cancer tissue revealed significantly higher expression of defensin in the N0 group.
Conclusions.
Defensin (DEFB4A, DEFB103B, DEFB4B) may be a novel biomarker for early regional metastasis in T1/2 tongue cancer.
INTRODUCTION
In oral cavity cancer, 6% to 85% of cases have regional metastasis [1]. As the extension of lymph node metastasis in the neck is one of the most important prognostic factors, elective neck dissection, sentinel lymph node biopsy, radiation therapy, and observation are possible treatment options for clinically lymph node-negative oral cavity cancer. Among oral cavity cancers, tongue squamous cell carcinoma is a particularly well-studied subsite [2]. Several clinicoradiologic and pathologic parameters have been suggested, one of the most important of which is the invasion depth of the primary tumor [3]. However, the limitation of using depth of invasion as a cutoff is the difficulty in obtaining this information preoperatively. To overcome this limitation, staged neck dissection or a deep preoperative biopsy can be another option, although the clinical feasibility of this option is low because of sampling error and the fact that few surgeons prefer this option. The T stage is another parameter for predicting regional metastasis in clinically node-negative oral cancer [4]. Most cases of tongue cancer with a T stage higher than T2 can be suggested as candidates for elective neck dissection.
Elective lymph node dissection is part of the treatment of patients with clinically node-negative tongue squamous cell carcinoma. The main disadvantage of this procedure is that it may produce significant disability and scarring; thus, ideally it should be avoided in patients with pathologically negative lymph nodes. Until recently, a limited number of studies using genetic information of tongue cancer have evaluated the association between genetic profiles and early regional metastasis of tongue cancer. We aimed to analyze differences in the gene expression profile between oral tongue cancer patients who were positive and negative for lymph node metastasis and to search for genetic markers for selecting eligible patients for elective neck dissection.
MATERIALS AND METHODS
This study was approved by the Institutional Review Boards of Seoul National University Hospital (No. 1712-014-903) and Boramae Medical Center (No. L-2017-442). Written informed consent was obtained from all participants, and all of the methods were performed in accordance with the relevant guideline and regulation.
Human tumor samples
All samples were collected and preserved in Seoul National University Hospital Human Biobank. Among the head and neck cancer patients who were diagnosed and surgically treated, a total of 49 fresh tongue squamous cell carcinoma samples were collected from January 2012 to December 2016. Among the samples, final pathologic T stage 1 and 2 nonrecurrent cases were selected for evaluation (n=35) (Supplementary Table 1). All of the enrolled patients were clinically N0, which means that preoperative imaging studies (positron emission tomography, computed tomography, and magnetic resonance imaging) revealed that there was no suspicious metastatic lymph node in neck. Patients in N0 group underwent elective neck dissection, and final pathologic lymph node status were as shown in Supplementary Table 1. Age, sex, tumor size and thickness, nearest resection margin, and level and number of metastatic lymph nodes were collected for the patients from which the samples were collected. To analyze the differences in expression of the transcriptome in tumors with early regional metastases, 35 patients were categorized into two groups: (1) the N0 group (n=23) with no regional metastasis (pN0) and (2) the N+ group (n=12) with positive regional metastasis (pN1 and 2).
mRNA sequencing
Total RNA concentration was calculated by Quant-IT RiboGreen (Invitrogen, Walsum, MA, USA). To determine the DV200 (% of RNA fragments >200 bp) value, samples are run on the TapeStation RNA screentape (Agilent, Santa Clara, CA, USA). A total of 100 ng of total RNA was subjected to a sequencing library construction using a TruSeq RNA Access library prep kit (Illumina, San Diego, CA, USA) according to the manufacturer’s protocols. Briefly, the total RNA was firstly fragmented into small pieces using divalent cations under elevated temperature. The cleaved RNA fragments are copied into first strand cDNA using SuperScript II reverse transcriptase (Invitrogen, #18064014) and random primers. This is followed by second strand cDNA synthesis using DNA Polymerase I, RNase H and dUTP. These cDNA fragments then go through an end repair process, the addition of a single “A” base, and then ligation of the adapters. The products are then purified and enriched with PCR to create the cDNA library. All libraries were normalized and six libraries were pooled into a single hybridization/capture reaction. Pooled libraries were incubated with a cocktail of biotinylated oligos corresponding to coding regions of the genome. Targeted library molecules were captured via hybridized biotinylated oligo probes using streptavidin-conjugated beads. After two rounds of hybridization/capture reactions, the enriched library molecules were subjected to a second round of PCR amplification. The Captured libraries were quantified using KAPA Library Quantification kits for Illumina Sequencing platforms according to the qPCR Quantification Protocol Guide (Kapa Biosystems, Wilmington, MA, USA; #KK4854) and qualified using the TapeStation D1000 ScreenTape (Agilent, Santa Clara, CA, USA; #5067-5582). Indexed libraries were then submitted to a Illumina Hiseq2500 (Illumina), and the paired-end (2×100 bp) sequencing was performed by the Macrogen Incorporated.
We preprocessed the raw reads from the sequencer to remove low quality and adapter sequence before analysis and aligned the processed reads to the Homo sapiens (hg19) using HISAT v2.0.5 [5]. HISAT utilizes two types of indexes for alignment (a global, whole-genome index and tens of thousands of small local indexes). These two types of indexes are constructed using the same BWT (Burrows–Wheeler transform)/a graph FM index as Bowtie2. Because of its use of these efficient data structures and algorithms, HISAT generates spliced alignments several times faster than Bowtie and BWA widely used. The reference genome sequence of Homo sapiens (hg19) and annotation data were downloaded from the UCSC table browser (https://genome.ucsc.edu). Transcript assembly and abundance estimation using StringTie [6,7]. After alignment, StringTie v1.3.3b was used to assemble aligned reads into transcripts and to estimate their abundance. It provides the relative abundance estimates as FPKM values (Fragments Per Kilobase of exon per Million fragments mapped) of transcript and gene expressed in each sample.
Differentially expressed gene analysis and gene ontology enrichment/KEGG pathway analysis
Differentially expressed genes (DEGs) between the N0 and N+ groups were identified by two-tailed Student t-tests using the Linear Models for Microarray Data (Limma) package in R. The alpha level was 0.4 and adjusted P-values were obtained. DEG was defined as the genes with fold change >2 with adjusted P-value <0.01. DAVID web-based program was utilized for gene ontology (GO) enrichment analysis and functional annotation. DAVID network software (NIH, Bethesda, MD, USA) consist of the most of major public resources of bioinformatics data. Gene-related biological mechanisms with standardized gene terminology can be analyzed using DAVID. In addition, high-throughput gene functional analysis can be facilitated by the DAVID knowledge base. The set of DEGs and the associated biological pathway information for the gene sets were analyzed by the DAVID.
Analysis of immune cell infiltration
According to the LM22 signature file, which is the signature profiles for 22 distinct immune cell types, gene expression data were analyzed in Cibersort program [8].
Validation using TCGA data and immunohistochemical stain
Among The Cancer Genome Atlas (TCGA) Illumina Hiseq Rnaseqv2 data and matched clinical data, oral tongue cancer patients with T stage 1 or 2 were included. A total of 70 cases were divided by status of lymph node metastasis: N0 (39 cases) and N+ (31 cases). Using the Student t-test, DEG expression was compared between two groups.
The paraffin sections (4 μm) of tumor tissues were cut, deparaffinized, and treated with 0.03% H2O2 in methanol for 10 minutes to quench endogenous peroxidase activity. After washing in phosphate buffered saline (PBS), the sections were then incubated overnight at 4°C with beta-defensin 3 antibody (1:10, Novus Biologicals, Littleton, CO, USA). During the next day, the sections were treated with secondary antibody (Vector laboratories, Newark, CA, USA) in PBS (1:400) for 2 hours at room temperature. Then, antigen-antibody complexes were detected using an avidin-biotin complex detection system (Vectastain ABC kit, Vector Laboratories) and a DAB Substrate kit (Vector Laboratories). After counterstaining with Mayer’s hematoxylin, the sections were examined using an Olympus BX51 microscope. The pictures were captured in Olympus DP72 and DP2-BSW (Olympus, Tokyo, Japan). Histological sections were analyzed using Image J Software (NIH), and semiquantitative analysis was performed by intensity of staining.
RESULTS
Clinicopathologic data
The N0 and N+ groups showed no significant differences in age, sex, tumor size and thickness, or the nearest resection margin (Table 1). Recurrence was higher in the N+ group, although this difference did not reach statistical significance.
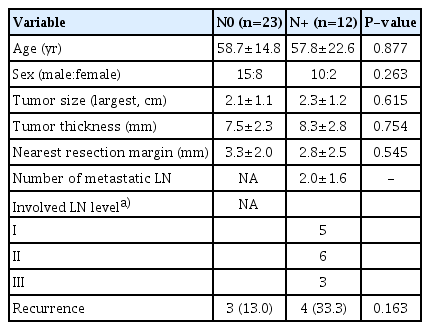
Clinicopathologic data of the N0 and N+ groups
DEGs and differences in immune cell infiltration
Among a total of 51 DEGs, 14 were upregulated and 37 were downregulated (P<0.01; fold-change >2) (Fig. 1). Via heatmap analysis, the N0 and N+ groups showed moderate clustering of DEGs (Fig. 2). The most significant differences were found in the six following genes: DEFB4A, SPRR2B, DEFB103B, SPRR2G, DEFB4B, and FAM25A. No significant differences were found in the infiltration of the 22 different types of immune cells between the N0 and N+ groups (Fig. 3). Additionally, the ratio of M1 to M2 macrophages also showed no significant difference (P=0.661).
Differentially expressed genes (DEGs). Among 51 DEGs, DEFB4A, SPRR2B, DEFB103B, SPRR2G, DEFB4B, and FAM25A were the most significantly downregulated genes.

Heatmap.

Analysis of immune cell infiltration. Immune cell infiltration was analyzed using the CIBERSORT program. No significant differences were observed in the 22 different types of immune cells including macrophage and dendritic cells (shadow) (A) and the ratio of M1 to M2 macrophages (B). NK, natural killer.
GO enrichment/KEGG pathway analysis and expression of DEFB in TCGA
The enriched DEGs are listed in Table 2. The highest enrichment score (7.39) was associated with “secreted,” “signal,” and “disulfide bond.” The second highest score (4.83) was associated with “protease inhibitor,” “serine protease inhibitor,” and “negative regulation of endopeptidase activity.” DEFB, which had the most significantly different expression between the two groups, was associated with “antibiotic,” “antimicrobial,” “beta defensin type,” “defense response to bacterium,” and “defensin.” In the TCGA database, DEFB4A and DEFB103B were more highly expressed in the N0 group than in the N+ group, although this difference did not reach statistical significance (Fig. 4).

GO enrichment and KEGG pathway analysis

The Cancer Genome Atlas data analysis. Although statistical significance was not reached, the N+ group showed lower levels of DEFB103B and DEFB4A. NS, not significant.
Immunohistochemical staining
Immunohistochemical staining showed significantly higher expression of defensin in the N0 group (P<0.01) (Fig. 5).
Immunohistochemical (IHC) staining of beta-defensin. (A) The intensity of defensin staining was measured and compared using ImageJ software. The independent t-test revealed that the two groups showed significant differences (P<0.01). (B) Representative images of defensin staining of each group (upper, ×100 magnification; lower, ×200 magnification). The composition of defensin in the cancerous epithelium was significantly higher in the N0 group compared to the N+ group.
DISCUSSION
Gene expression profiling has been shown to be a feasible method for determining the prognosis and early detection of several cancers [9]. Previous studies have demonstrated that the profile of gene expression can serve as a potential indicator for predicting lymph node metastasis in oral cavity cancers [10]. Watanabe et al. [11] reported that the expression profile of a panel of 19 genes allowed the prediction of lymphatic metastasis of oral tongue cancer. The prediction of lymph node metastasis is very important in early-stage tongue cancer because an accurate prediction may prevent unnecessary neck dissection. Although tumor thickness is a very useful and strongly reliable parameter for cervical lymph node metastasis, correct measurement of pathologic thickness is near impossible in a preoperative setting. Gene expression can be good alternative for lymph node metastasis prediction in early-stage tongue cancer. van Hooff et al. [12] reported that the combination of the gene expression profile and current clinical parameters could reduce the rate of pathologically node-negative cases in elective neck dissection from 28% to 11% in patients with early-stage oral squamous cell carcinoma. They concluded that a reduced rate of undetected nodal metastasis should be sufficient to encourage clinicians not to perform unnecessary neck treatment in node-negative patients.
In our study, reduced expression of defensin-related genes (DEFB4A, DEFB103B, and DEFB4B) was associated with regional metastasis to the neck in early-stage tongue cancer. The innate immune system plays a critical role in defending the host against pathogens in addition to the development of adaptive immunity to bacteria, fungi, and viruses. In particular, mucosal cells generate various kinds of antimicrobial peptides that inhibit the growth and invasion of many kinds of pathogens. Among those, defensins are cationic antimicrobial peptides [13-15], and there are 6 and 28 human α-defensins and β-defensins, respectively. β-defensins are usually located in the skin, airways, uterus, and oral cavity [16,17]. Human β-defensins are known to connect adaptive immunity with innate immunity and facilitate their interactions by binding to CCR6 and increasing the chemotactic activity for memory T cells and immature dendritic cells [18].
Sass et al. [19] reported that the migration of colon cancer cells could be inhibited by human β-defensin-3. They found that human β-defensin-3 is expressed in tumor-infiltrating monocytes, and not in colon cancer cells. In addition, the migration of various colon cancer cell lines was inhibited after exposure to human β-defensin-3, although human β-defensin-3 did not affect the proliferation of these cells. In addition, mutations of defensin-associated genes or cancer-specific losses of human β-defensin expression have been detected in renal cell carcinoma, basal cell carcinoma, and prostate cancer [20,21]. The inhibition of tumor cell growth and apoptosis can be induced by transduction of the defensin gene or treatment with recombinant human β-defensin [22]. Therefore, researchers have proposed that human β-defensin might be a potential suppressor of tumor growth.
Similarly, human β-defensin expression was detected in normal oral cavity mucosa [23], while its expression was decreased in some precancerous lesions, oral cavity cancer tissues, and cell lines [24]. Han et al. [25] analyzed the role of human β-defensin in oral cancer progression and its role as a prognostic and diagnostic parameter and therapeutic target, and showed that human β-defensin inhibited the migration and invasion of oral cavity cancer. Our study demonstrated that immune cell infiltration was not significantly different between the N0 and N+ groups. Considering this result, the expression of defensin-related genes by immune cells around the tongue cancer lesion may be an important parameter, rather than the extent of immune cell infiltration, particularly in early-stage cancers.
Several studies have evaluated the use of saliva samples for the detection of oral cavity cancer. Cao et al. [26] reported that the methylation of genomic loci that encode microRNA biomarkers represents a promising and novel screening tool, and found that a seven-microRNA panel was able to accurately find oral cavity cancer in saliva. In addition, Gualtero and Suarez Castillo [27] reported the biomarkers in saliva for the detection of oral cancers and their possible utilization for early detection. Considering that defensin can be detected in the saliva of normal and patients with oral cancer [28], we propose that further study could elucidate the role of salivary defensin in tongue cancer diagnosis and prognostic prediction.
Although decreased defensin expression may be associated with cancer metastasis, contrary results have also been reported. Shuyi et al. [29] reported that β-defensin was strongly expressed and significantly associated with lymphatic invasion in oral cancers. In addition, Mburu et al. demonstrated that β-defensin represents an nuclear factor kappa B (NF-kB)-regulated mediator of CCR7 expression and anti-apoptotic signaling, which may be exploited by developing treatments for patients with head and neck cancer to enhance their survival and reduce metastasis [30]. As a limitation of our study, the small sample size in our analysis might decrease the validity and credibility of the conclusions. In addition, external validation was not conducted in our study, which might increase the possibility of bias. Therefore, our results may not be conclusive, and future study is needed to clarify the potential role of defensin expression in tongue cancer metastasis. For this reason, we plan to perform a genetic network study to better predict metastasis in a multiple gene expression prediction model.
In conclusion, defensin (DEFB4A, DEFB103B, DEFB4B) may be a novel biomarker for early regional metastasis in T1/2 tongue cancer. However, because the sample size of this study was very small and the differential expression of the genes did not reach significance in the TCGA dataset, further validation should be performed to establish the clinical usefulness of these findings.
HIGHLIGHTS
▪ In this study, we aimed to analyze the gene expression profile to select patients eligible for neck dissection of T1/2 and node-negative tongue cancer.
▪ We found that defensin (DEFB4A, DEFB103B, DEFB4B) may be a novel biomarker for early regional metastasis in T1/2 tongue cancer.
SUPPLEMENTARY MATERIALS
Supplementary materials can be found online at https://doi.org/ 10.21053/ceo.2022.00150.
Inclusion of T1/2 tongue cancer
Notes
No potential conflict of interest relevant to this article was reported.
AUTHOR CONTRIBUTIONS
Conceptualization: DYL, JHH, SKK. Data curation: DYL, JHH. Formal analysis: DYL. Methodology: JHH, WJJ, EJC, TKK, SHA, MWS. Visualization: DYL, SKK. Writing–original draft: DYL, SKK. Writing–review & editing: DYL, SKK.
Acknowledgements
This work was supported by a National Research Foundation of Korea (NRF) grant funded by the Korean government (MSIT) (No. 2018R1D1A1B07047534). This research was supported by the National Research Foundation of Korea (NRF) grant funded by the Korean government (MSIT) (No. 2020R1A4A4079931) and by the Bio & Medical Technology Development Program of the NRF funded by the Korean government (MSIT) (No. 2019- M3A9H1103617). Also, this research was supported by Korean Fund for Regenerative Medicine funded by Ministry of Science and ICT, and Ministry of Health and Welfare (RS-2022-00070684, Republic of Korea). This study was also supported by a clinical research grant provided from Seoul National University Boramae Medical Center.