


INTRODUCTION
Otitis media has one of the highest disease prevalence rates in the world [1,2]. However, otoscopic screening is highly subspecialized, creating diagnostic difficulties for primary care providers whose otologic diagnoses are relatively inaccurate. The average diagnostic accuracy for acute otitis media (AOM) and otitis media with serous effusion (SOM) using video otoscopy is only 51% and 46%, respectively. By contrast, the diagnoses of otolaryngologists are more accurate, although very far from perfect, with a diagnostic accuracy of approximately 74%. Hence, there is a need for a new diagnostic strategy to improve the diagnostic accuracy and more effectively screen patients with otologic diseases based on abnormal otoscopic findings. Because of the limited number of otolaryngologists covering all regions and the rapid development of telemedicine worldwide, tele-otoscopy may be beneficial in optimizing diagnoses and treatments for otitis media [3].
Artificial intelligence (AI)-based techniques, particularly disease screening tools to support clinicians’ decisions, have impacted and improved the traditional provision of healthcare. Deep learning is the leading AI method for a wide range of tasks, including medical imaging problems. Deep neural networks have recently been applied for otologic diagnoses, with great success. Moreover, many trials analyzing the tympanic membrane (TM) have shown the usefulness of deep learning models in the early detection and treatment of ear diseases [4,5]. However, although those models showed high-accuracy diagnoses based on the TM, such techniques have limitations in being successfully deployed into clinical practice. These limitations are due to the underlying unexplainable “black-box nature” of deep learning algorithms. To support the clinical use of deep learning algorithms, studies should be conducted to identify understandable algorithms. Moreover, an AI system to complement medical professionals should have a certain amount of explainability and allow human experts to retrace decisions and use their judgment [6]. Medical image segmentation has emerged as a biomedical image processing technology in deep learning algorithms to support the explainability of decisions [7].
The normal TM has several properties that make it distinguishable from an infected TM. Therefore, the objective of this study was to develop and evaluate a software prototype using a deep convolutional neural network (CNN) model based on the segmentation of a normal TM into five substructures (malleus, umbo, cone of light, pars flaccida, and annulus) to identify abnormalities in otoscopic ear images. Using a combination of thresholds among the five substructures would help improve the accuracy of discriminating between normal and abnormal TMs. This would also enable the appropriate triaging of middle ear diseases for primary clinicians and facilitate the timely transfer of findings to otologic specialists.
MATERIALS AND METHODS
Ear imagery database
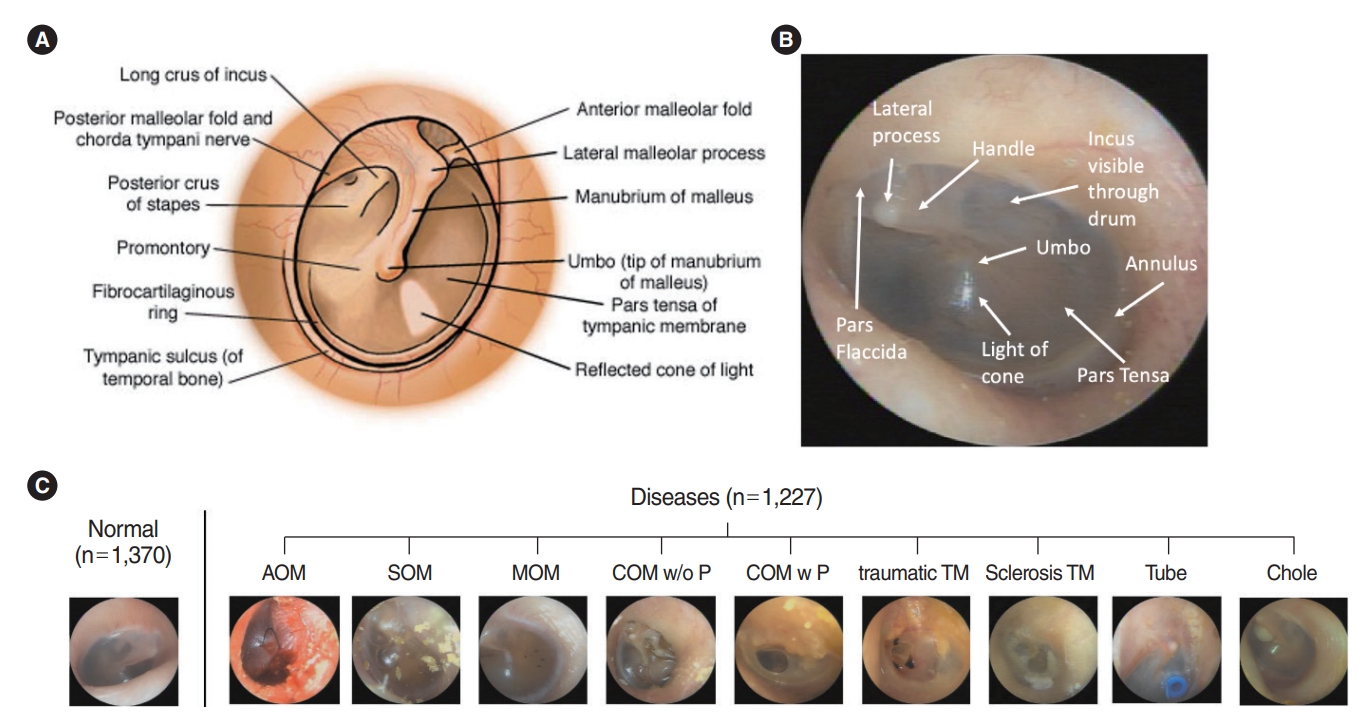
Medical images of eardrums from patients who visited the outpatient clinic in the Department of Otorhinolaryngology, Wonju Severance Christian Hospital, from 2015 to 2020 were used retrospective. This study was approved by the Institutional Ethics Review Committee (CR19081) and adhered to the principles of the Declaration of Helsinki. Eardrum images were taken by otolaryngology residents and professors using 2.7 and 100 mm Insight 0° telescopes (mione) equipped with a full HD camera system with a 21.5´´ LED monitor. The resolution of the images was 1,920×1,080, 60 fps with an illuminance of 30 and 000 lx. A total of 12,444 endoscope photos were reviewed and screened by two ENT surgeons. Mostly subjective and reliable images were selected by the specialized otologists for defined images in each disease after removing the images which had vague boundaries of substructures on TM, 2,597 photos of which were deemed appropriate and hence included for examination. We classified 1,370 photos in the normal TM group and 1,227 in the abnormal TM group. We included nine ear diseases (acute otitis media [AOM], SOM, otitis media with mucoid effusion [MOM], chronic otitis media without perforations [COM w/o P], chronic otitis media with perforations [COM w P], traumatic drum perforation [traumatic TM], tympanosclerosis [sclerosis TM], tympanostomy tube inserted status [Tube], and congenital cholesteatoma [Chole]), as shown in Fig. 1.
This retrospective study was approved by the Institutional Review Board of Yonsei University College of Medicine (No. Yonsei IRB-CR319081). All participants voluntarily signed the written informed consent and joined in this study. Among the 2,597 images used for this study, the training set was composed of 2,358 images (90%), and the validation set was composed of 239 images (20%) chosen randomly.
Data preprocessing
Eardrum photos were labeled as 10 categories, including normal TM and nine diseases (AOM, SOM, MOM, COM w/o P, COM w P, traumatic TM, sclerosis TM, Tube, and Chole). We followed the guideline of the American Academy of Otolaryngology–Head and Neck Surgery (2016) [8] to define the diseases with the retrospective clinical records of patients. AOM refers to the rapid onset of signs and symptoms of inflammation of the middle ear. Otitis media with effusion (OME) is the presence of fluid in the middle ear without signs or symptoms of acute ear infections. COM is an OME persisting for 3 months from the date of onset (if known) or from the date of diagnosis (if onset is unknown). Furthermore, we added the tympanosclerosis group for comparison to a normal eardrum because plaques could shade the visualization of normal substructures, such as the cone of light, umbo, or malleus. Images of a normal TM should not have any surgical history of ear and chronic otitis media, and they also should include the five substructures (malleus with lateral process and handle, whole annulus, pars flaccida, umbo, and cone of light) [9]. Along with the unique pearl gray or white color in the pars tensa of the TM, a normal TM has a translucent and concave-shaped membrane (umbo, center of the TM) with malleus bone visibility. Light reflection, also known as the cone of light, is another important feature. Earwax should be below 10% of the whole eardrum in the image. The number of images used and samples representing each classification is shown in Fig. 1.
Labeling segmentation extraction from the normal TM
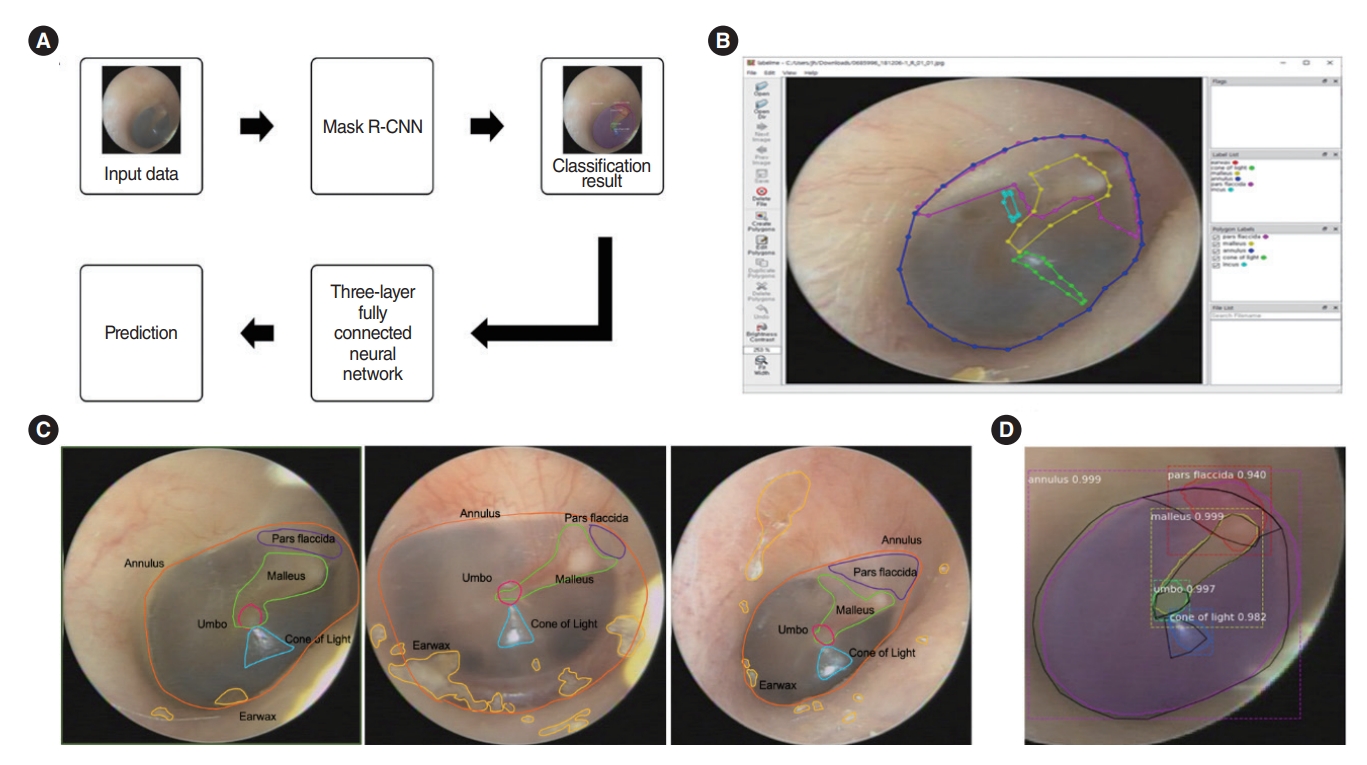
An in-house graphic user interface software implemented on MATLAB2019a (MathWorks Inc.) was used for manual labeling. As shown in Fig. 2, filmed otoscopic images that contained both ears were divided into two segmented images, i.e., the right and left parts. The images were manually labeled with the contours of the five substructures (malleus with lateral process and handle, whole annulus, pars flaccida, umbo, and cone of light) by two specialized otologist (YJS and THK). When all five substructures in one image were confirmed by the otologists, it was used as the training data. We used “LabelMe,” a database and an online annotation tool that allows the sharing of images and annotations. This online tool provides functionalities, such as drawing polygons, querying images, and browsing the database [10]. The labeling results were converted into JSON files.
Deep learning models to discriminate the normal TM and abnormal TM
The learning process shown in Fig. 2A was performed. The mask R-CNN by Matterport Inc. (https://github.com/matterport/Mask_RCNN) with ResNet-50 was used to detect and segment the contours of predicted substructures. The classification result of the mask R-CNN was passed through a three-layer fully connected neural network to detect the presence of an ear disease. To extract features from the eardrum image, Matterport’s mask R-CNN model was used, and ResNet-101 was used as the backbone [11]. Mask R-CNN was trained with a batch size=4, learning momentum=0.9, and weight decay=10–4. Up to epoch 100, only the head part was trained with a learning rate of 10–2; up to 340, layers of stage 4 or higher were trained with a learning rate of 10–3; and finally up to epoch 400, the entire layer was trained with a learning rate of 10–4. In the model training process, random flips were performed in the horizontal direction of the inputted images to augment the data, and the training datasets were inputted into a deep neural network to extract the features of the eardrum image sample. The k-fold cross-validation was used as a tool to evaluate machine learning models. Then, we observed the performance of the training model until the values were stabilized. In addition, based on the weight obtained through the above learning process, we extracted the classification probability value of the input data of the three-layer fully connected neural network. Through this neural network, the presence or absence of an eardrum disease is judged. In the neural network for judging the presence of an ear disease, two fully connected layers of size 32 were used. To prevent overfitting, L2 regularization of 10–4 and dropout of 0.5 were applied, and the epoch value was set to 1,000 for learning. While processing the data, we extracted the mask R-CNN classification probability value by entering the input of the above process. Then, we identified the missing value for the class that was not detected. This study was performed using the TensorFlow deep learning framework on multiple GPU (Tesla V100, NVIDIA) to increase the training speed of neural network. Supplementary Fig. 1 shows the training and validation loss graphs according to the epoch of the mask R-CNN classification, and the results was obtained by inferring the test data based on the weights obtained through transfer learning.
Statistical analysis
The metrics used for evaluating the performance of the final model were calculated using a one-versus-rest strategy applied separately for each class. The F1 score provides a harmonic mean of the sensitivity (recall) and positive predictive value (precision). Receiver operating characteristic (ROC) analyses, including the area under the curve (AUC), were performed separately for each class by varying the cut-off applied to the probabilistic output of the neural network for the class in question using the IBM SPSS 23.0 statistical software (IBM Corp.). The micro-averaged ROC AUC was calculated using Scikit-learn.
RESULTS
Accuracy of TM segmentation
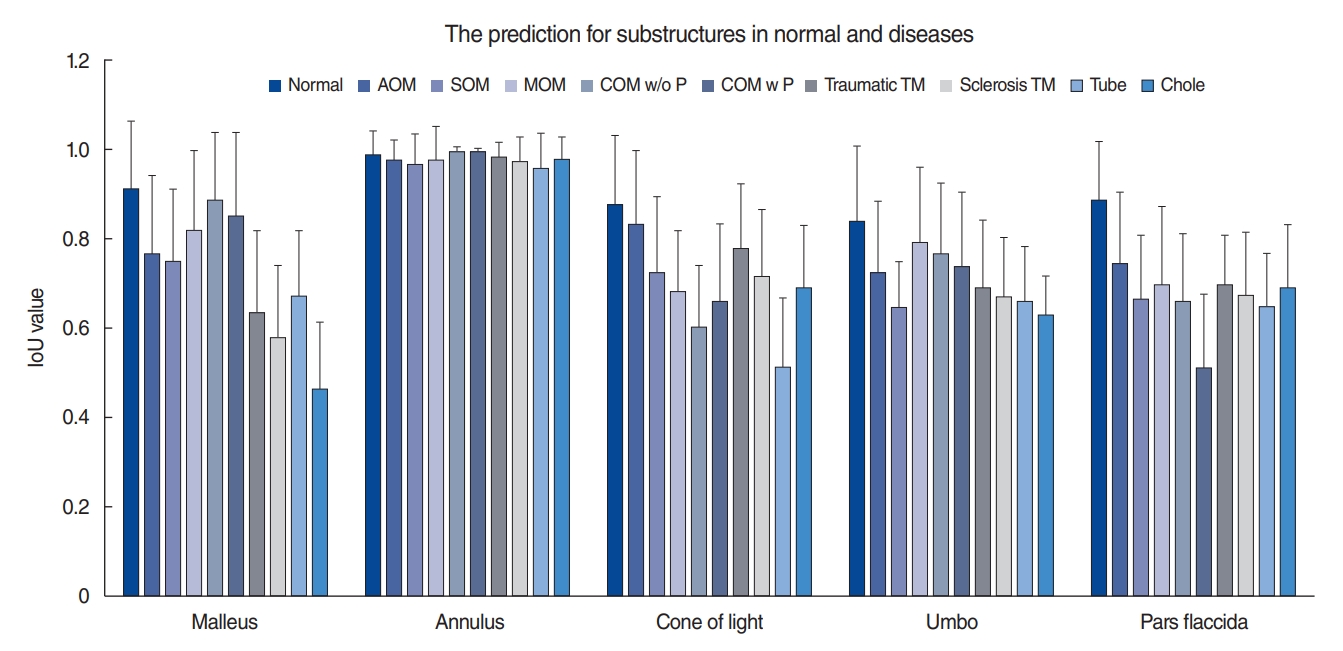
Supplementary Fig. 1 shows the results of training with several epochs to obtain good results, as well as the loss curves in the training and validation sets. An example of the classification results with five substructures using the mask R-CNN model is shown in Fig. 3. We analyzed the results upon dividing the images into individual structures, and we evaluated the detection rate and segmentation accuracy using the intersection over union (IoU) score. The average IoU scores in the normal group were 0.9±0.14 for the malleus, 0.99±0.05 for the annulus, 0.88±0.15 for the cone of light, 0.84±0.17 for the umbo, and 0.89±0.13 for the pars flaccida (Fig. 3). The most significant differences were found between the normal and disease groups in the malleus and pars flaccida. With a cut-off value of 0.8, we could distinguish normal from abnormal TMs with each of the malleus, cone of light, umbo, or pars flaccida.
Accuracy of discriminating between normal and abnormal TMs through deep learning
Because missing IoU values below 0.5 were applied, the optimal missing value could be found and replaced in each substructure. To make the best distinction between the normal and abnormal groups, the following missing values for each class were entered: malleus, 0.2; cone of light, 0.7; pars flaccida, 0.2; annulus, 0.8; and umbo, 0.3.
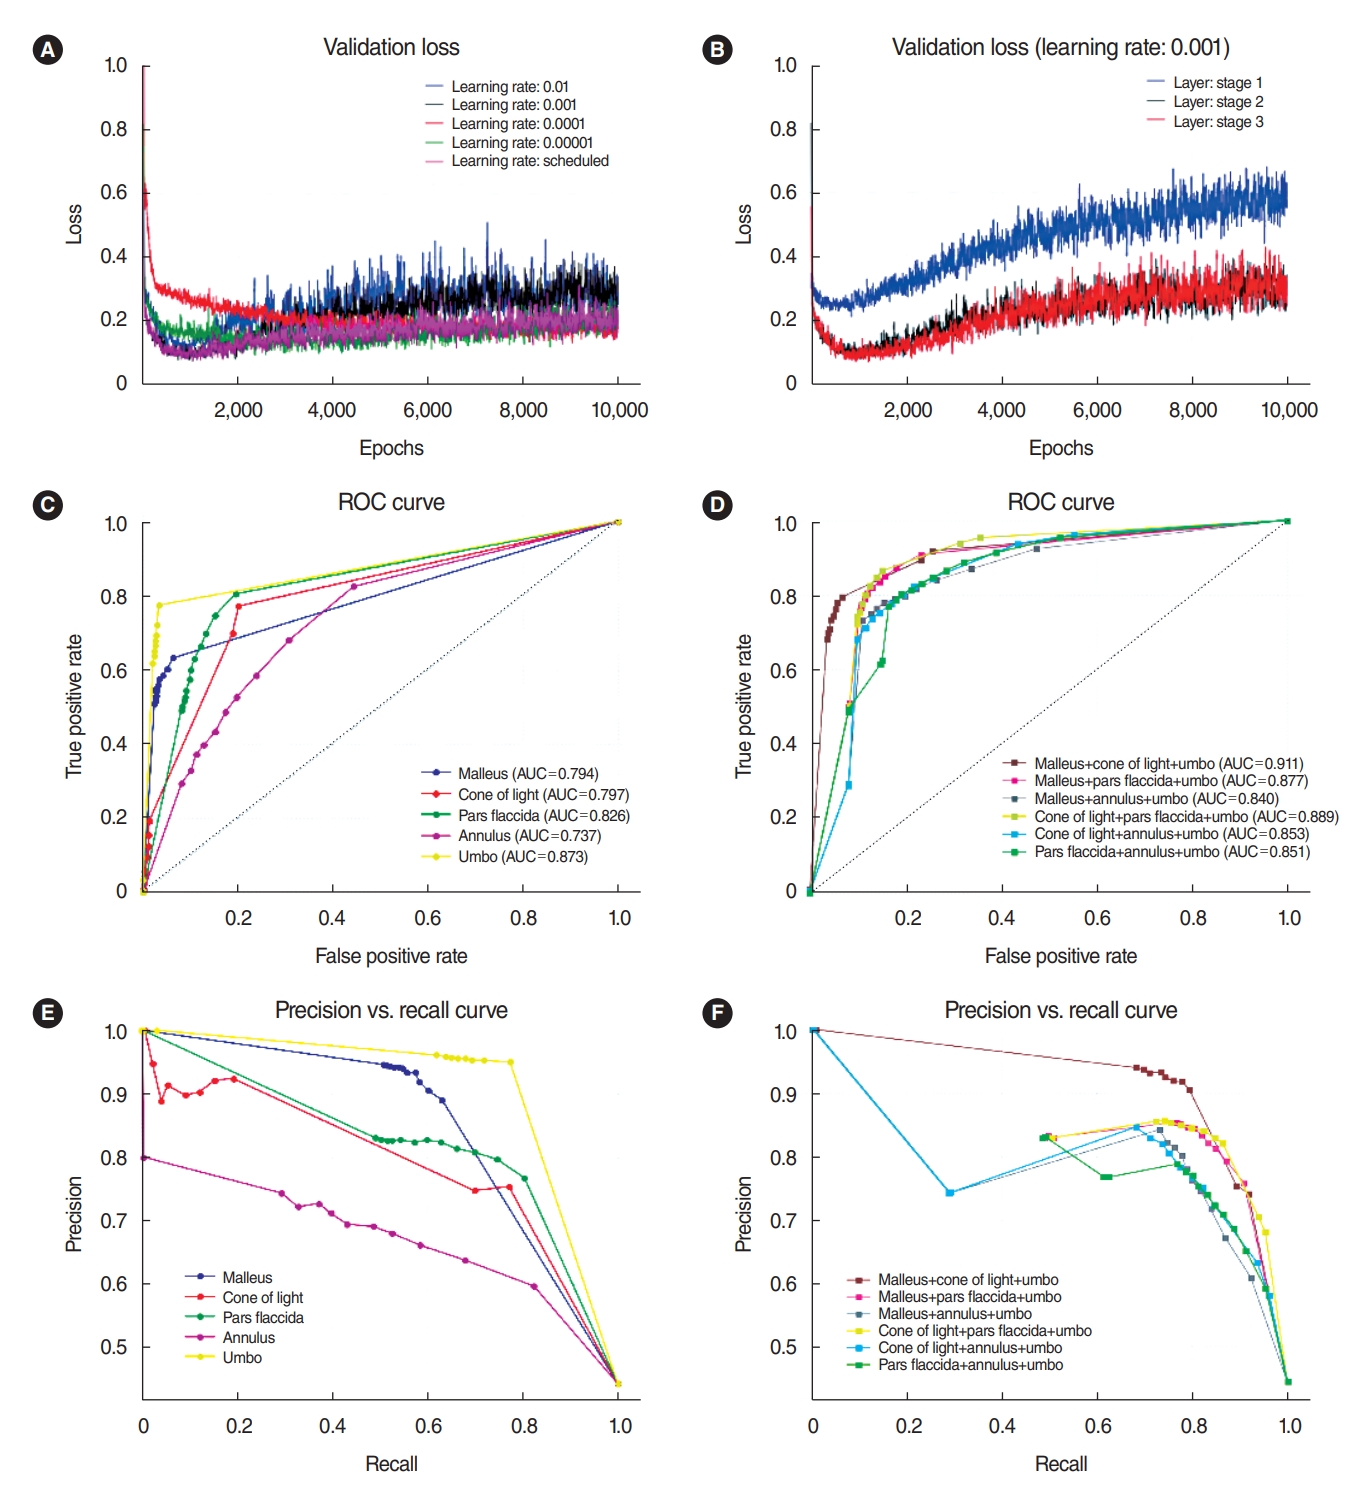
We achieved a high level of accuracy for the mask R-CNN model by fine-tuning the learning rate (0.01, 0.001, 0.0001, 0.00001, or scheduled), and we obtained better results with a learning rate of 0.001 (Fig. 4A). We also tested the fine-tuning of layers with stage 1 (network heads), stage 2 (over Resnet stage 4), and stage 3 (all layers), and we chose the layer of stage 2 as having the lowest validation loss and lowest computation power (Fig. 4B). The model with the best performance on the validation data was evaluated using the test set.
The ROC curves for each subgroup are shown in Fig. 4C. The highest AUC was 0.873 for the umbo, 0.826 for the pars flaccida, 0.797 for the cone of light, and 0.794 for the malleus. The annulus (AUC, 0.737) did not have a suitable structure for discriminating between normal and abnormal TMs. To increase sensitivity and specificity, we combined several segmentations to classify the TM in diseases from the normal TM (Fig. 4D). Based on the three-layer fully connected neural network, we obtained ROC curves for the optimal conditions for distinguishing between the presence and absence of eardrum diseases. Except for the annulus substructure, we could obtain good prediction results with combinations of the other four substructures (20 f combinations). We could also diagnose abnormal TMs with the malleus, cone of light, and umbo compared to the normal TM, which showed a satisfactory result (AUC, 0.911). This value was higher than those obtained for each substructure separately. The scores of precision and recall for the combination of malleus, cone of light, and umbo were better than those obtained for each substructure separately or for other combinations (Fig. 4E and F).
Accuracy of discriminating between normal TMs and TMs with each disease
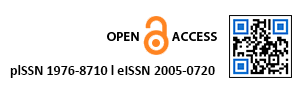
Finally, we applied the deep learning model with a gradient boosting classifier because it had the highest values of accuracy, precision, recall, and F1 (Supplementary Fig. 2). We compared the precision, recall, F1, and support values between the normal TMs and TMs with each disease (AOM, SOM, MOM, COM w/o P, COM w P, traumatic TM, sclerosis TM, tube, and Chole). Significant values (AUCs over 0.911) were found for SOM, MOM, COM w/o P, COM w P, traumatic TM, tube, and Chole. Insufficient specificity was found for the AOM and sclerosis TM groups. The combined group of SOM, COM w P, and traumatic TM had the most significant values (precision, 0.950; recall, 0.960) in comparison to the normal TM group (Fig. 5).
DISCUSSION
This deep neural network framework is the first prototype implementation of a CNN for the substructure-based classification of TMs with disease as compared to completely healthy ears. The classification accuracy of the current model reached 91.1% with the combination of the malleus, cone of light, and umbo substructures, which was higher than those of deep learning models based on a single substructure. We could increase the precision to 0.950 and the recall to 0.960 to discriminate between normal TMs and those with certain diseases. A medical diagnosis needs to be transparent, understandable, and explainable to gain the trust of clinicians. Hence, we believe that this method of ear image segmentation would be an important first step in numerous applications. It segmented images into five anatomically meaningful regions (malleus, umbo, cone of light, annulus, and pars flaccida), based on which substructures could be extracted. Other deep learning studies on ear diseases have classified several diseases using images of the entire TM. Cha et al. [4] proposed an image classification model based on transfer learning with a deep CNN, which classified middle ear and external auditory canal pathologies into six categories with a mean accuracy of 93.73%. Another study reported that otoendoscopic images of the eardrum and external auditory canal were classified into eight categories. The classification accuracy of the current model reached 95.59% [5]. Even though those models showed high accuracies, they have insufficient explainability, which would allow human experts to retrace decisions and use their judgment for disease diagnoses. The analysis of medical images with segmentations delineating the anatomical or pathological structures can help explain the role of how deep learning models in medical imaging diagnoses. Typical medical image segmentation tasks include brain and tumor segmentation, cardiac segmentation, liver and tumor segmentation, and cell and subcellular structures [12]. The AUC values ranged between 0.864 and 0.937 for diagnosing lung nodules or lung cancer on the chest X-ray examinations or computed tomography scans [13]. For breast imaging, the AUC values ranged between 0.868 and 0.909 for diagnosing breast cancer on mammograms, ultrasonography, magnetic resonance imaging, and digital breast tomosynthesis. Compared with these values, our deep learning algorithm with combinations of five substructures had high AUC values ranging from 0.905 to 0.932. Hence, using these five important normal anatomic structures would be an explainable and effective algorithm for screening abnormal TMs.
We included nine diseases (AOM, SOM, MOM, COM w/o P, COM w P, traumatic TM, sclerosis TM, tube, and Chole) in the group with abnormal TMs. However, we did discriminate the abnormal TMs compared with the normal TMs based on the five segmentations; hence, we did not classify all diseases into subgroups. Distinguishing only between normal and abnormal TMs would be meaningful in the primary medical care system. This deep learning model would support the primary screening for ear diseases before seeing a specialist. If a person is diagnosed with an abnormal TM using this method, then he or she must consult an otorhinolaryngology specialist for a further detailed diagnosis with additional tests, including a hearing test or computed tomography of the temporal bones. The diagnosis of various ear diseases with deep learning algorithms should not be overapplied to predict diseases based on only a single otoendoscopic image.
Mask R-CNN models are of enormous importance in medical imaging analysis. He et al. [11] proposed a mask R-CNN model in 2017. Mask R-CNN is a multitask network and can simultaneously implement detection and segmentation. It also detects small objects effectively, such as ear substructures, because of the introduction of the feature pyramid network mechanism. A cascaded CNN was designed with multiple layers of anisotropic and dilated convolution filters for automatic segmentation for brain tumors [14]. Mask R-CNN is an important AI-based scheme that has been used in automatic nucleus segmentation [15], lung nodule detection and segmentation [16], liver segmentation [17], automated blood cell counting, and multiorgan segmentation [18]. In otorhinolaryngological research, a CNN with transfer learning was used to classify dental diseases [19]. Mask R-CNN models can also be used in specialized areas, such as oral pathology [20]. Because the substructures of the TM can overlap with one another and be distorted under disease conditions, such as perforations or ear wax, the mask R-CNN was chosen in our study as the best deep learning algorithm to enable each substructure to be detected separately on otoendoscopic images. This method could effectively perform object detection and instance segmentation for five substructures of the TM.
Nonetheless, a limitation of this study is that clinicians should consider factors other than these five substructures (malleus, umbo, cone of light, annulus, and pars flaccida) when making a diagnosis. The red color of the TM can be noticed as a bulging shape of the TM of AOM. The bulging shape of the TM in otitis media changes the central concavity of the membrane, with loss or relocation of the cone of light [21]. OME shows small bubbles of fluid behind the TM, with several fluid characteristics. However, light reflection and the malleus bone can also be noted. The model developed in this study discriminated between normal and abnormal TMs using only these five substructures as normal TM components, not including the color of the TM, possible perforation, and otorrhea from the middle ear. We did not include further parameters because we did not try to classify the diseases into more detailed subgroups. The absence of membrane perforation in SOM will affect the judgment of the deep learning model for normal TMs. Although the color of the TM is important for deciding whether there is fluid behind the membrane, the light through otoendoscopy may cause biases in images. Based on this algorithm, we will add other parameters to discriminate among various diseases in future studies. A collaborative, multi-institutional approach to obtaining high-quality images would be necessary.
In light of many previous studies that have reported considerable accuracy for the diagnosis of ear diseases [4,22], this study demonstrated the usefulness of applying multiple-object detection and segmentation of five substructures using mask R-CNN in otoendoscopic images to discriminate between ear diseases and normal TMs. This model would help clinicians by enhancing explainability and allow human experts to retrace decisions and use their judgment for abnormal eardrums. The proposed model may achieve a high accuracy, similar to that of primary clinicians, who judge whether patients should be referred to a specialist or not. We hope that this automated algorithm will improve the diagnostic accuracy for abnormal TMs and facilitate appropriate and timely clinical referrals for consultations to improve patient’s quality of life in the context of primary care.
HIGHLIGHTS
▪ Artificial intelligence (AI)-based techniques can serve as screening tools for supporting clinicians’ decision regarding otitis media.
▪ Deep learning algorithms for segmentation with substructures of the tympanic membrane (TM) can distinguish between normal and abnormal TMs.
▪ Combination of substructures in the TM can increase the diagnostic accuracy for normal and abnormal TMs.
▪ The proposed model can support primary screening for ear diseases.