Normal Mastoid Air Cell System Geometry: Has Surface Area Been Overestimated?
Article information
Abstract
Objectives
The aim of this study was to emphasize the necessity of a standard in segmentation threshold and algorithm for measuring volume and surface area of mastoid air cell system (MACS).
Methods
First, we obtained axial computed tomography scans of 54 normal temporal bones from 27 subjects. Then, we manipulated Hounsfield units (HU) image data in DICOM (digital imaging and communications in medicine) files directly using our program. The volume and surface area of MACS were computed and compared at segmentation thresholds (HU) from –700 to 0 at intervals of 50 using 2 algorithms; square pixel based (SP) algorithm and marching square (MS) algorithm.
Results
No significant difference was found between the volumes computed by SP and MS algorithms at each segmentation threshold. The surface area computed by SP algorithm, however, was significantly larger than that by MS algorithm. We could minimize this significant difference through a modification of the SP algorithm. As the lower HU threshold value was set, the smaller volume was measured. The surface area showed a plateau at a threshold of approximately –200 HU. The segmentation threshold had greater influence on the measured volume of MACS than the algorithm did.
Conclusion
A standard method for measuring volume and surface area of MACS is thought to be necessary. We suggest that the MS algorithm and –200 HU of the threshold could be a standard in the measurement of volume and surface area of MACS.
INTRODUCTION
The mastoid air cell system (MACS) is a highly cellular, posterior extension of the middle ear. There is a certain agreement with regard to the role of MACS in pressure homeostasis of the tympanic cavity [1]. In order to play this role, MACS is thought to function as a pressure buffer and/or transmucosal gas exchanger [1].
While the function of MACS is not fully understood, many studies show that MACS volume is inversely related to certain pathologic conditions of the middle ear including cholesteatoma and otitis media [2,3]. There are several difficulties in the quantitative measurement of MACS pneumatization due to its structural complexity. In previous studies, volume and/or surface area of MACS were measured using commercial or free computer programs to analyze images [4-12]. However, few studies have clarified the segmentation threshold and algorithm used for measuring volume and/or surface area of MACS.
Although 4,096 different Hounsfield units (HU) values (–1,024 to +3,072; 12 bits) are used for storing computed tomography (CT) image data in a digital imaging and communications in medicine (DICOM) file, only 256 different gray values (0 to 255; 8 bits) are supported in conventional display devices or hard copy films. Linear transformation called windowing is employed to map the HU data to the 256 gray levels. This mapping is characterized by a window center and a window width. In this process, the 4,096 levels of HU data are reduced or degenerated into 256 gray levels. Grayscale image from even single HU data may vary with the window center and the window width. Common bitmap grayscale image formats such as BMP, PNG, and JPG have a maximum color (gray) depth of 8 bits (256 gray levels). In spite of these drawbacks, a lot of studies have adopted grayscale image conversion, since HU data are not supported in most software developed for quantitative image analysis.
The aim of this study was to emphasize the necessity of a standard in segmentation threshold (especially in HU) and algorithm for measuring volume and surface area of MACS.
MATERIALS AND METHODS
We obtained axial CT scans of 54 normal temporal bones from 27 subjects (15 men and 12 women; age range, 20 to 56 years) with normal otoscopic findings. We used CT scans taken previously for other purposes. This study was approved by an Institutional Review Board (ECT 13-36-02). The patients had no history of chronic otitis media, inner ear disease, or malformation of the temporal bone.
The scans were acquired in a plane parallel to the orbitomeatal plane with the following parameters: 120 kV, 320 mAs, 1.5-mm slice thickness, zero interslice gap, zero gantry tilt angle, 512 × 512 matrix and bone algorithm scan parameters. The resolution (pixel spacing) was 0.3125 mm.
All mastoid air cells were included in the scans, from the cranial fossa to the mastoid tip. For a temporal bone, 45–74 slices (average, 53 slices) were used in the study.
Segmentation threshold value in HU (not in gray values)
We wrote a DICOM parser and HU-based image software in Python programming language ver. 2.6 (Python Software Foundation, Wilmington, DE, USA) and Tkinter module (Python wrapper for Tcl/Tk) [13]. Our program can read and write DICOM files and it can process HU image data directly.
A HU threshold value should be designated for the segmentation of the air portion and the other nonair portion. In this study, it is not necessary to specify a gray value threshold, a window center, and a window level. Only an HU threshold is needed for quantitative analysis.
Preparation of DICOM files for analysis
For each slice, a new DICOM file was written after HU-based image processing with our software. This image processing was made semiautomatically and mainly by 2 modified flood-fill algorithms (Fig. 1). One was protected flood-fill, which replaces all pixels into arbitrary bone pixels (HU=1,200 in this study), except each tentative air pixel (HU<0) and its surrounding pixels within 2-pixel distance. The flood-fill was triggered from clicking a point outside the temporal bone area. No manual postprocessing of the segmentation results was performed. The other was guided flood-fill, which limits replacements with a given line segment. Since only clicked side was replaced, it was used to replace air pixels in the external auditory canal, namely outer side of a given line segment (tentative tympanic membrane), while protecting air pixels in the tympanum.

Grayscale representation (window center, 250; window width, 2,500) of Hounsfield units (HU)-based flood-fill processing. (A, B) Click-driven protected flood-fill safeguards each tentative air pixel (HU<0) and its surrounding pixels within 2-pixel distance. (C, D) Guided flood-fill protects air pixels of one (inner here) side of a given line segment (eardrum here).
Measurement of surface area and volume of MACS
For each slice, the perimeter (cm) and the area (cm2) were measured and summed across all images. These sums were multiplied by 0.15 cm (slice thickness) to yield surface area (cm2) and volume (cm3).
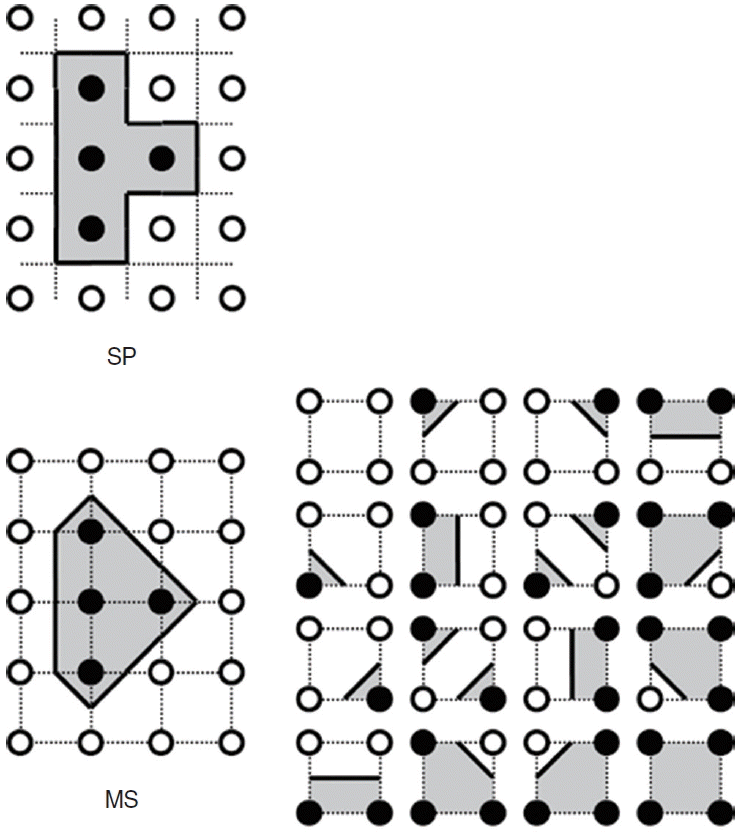
The perimeter and the area of each air cell could be computed in the 2-dimensional (2D) plane of each slice with several algorithms. Square pixel based (SP) algorithm and marching square (MS) algorithm were adopted and compared in this study (Fig. 2).
SP algorithm (2D), analogous to cuberille algorithm in 3D
The area of each air cell was computed from the count of pixel quantum under HU threshold (Fig. 3). In this algorithm, each pixel is thought of a small square with side length of pixel spacing (0.3125 mm in this study). The area of all air cells in a 2D slice plane should be an integer multiplication of the square value of the pixel spacing. Similarly, the perimeter of each air cell was counted, which should be also an integer multiplication of side length of the pixel spacing.

Schematic illustrations of square pixel based (SP) and marching square (MS) algorithm. In the SP algorithm, each square (pixel) has a center point with Hounsfield units (HU) value, while each square is determined by 4 corner points with HU value in MS algorithm. There are 16 possible configurations of each square in the MS algorithm.
MS algorithm
Unlike the square in SP algorithm, each square in MS algorithm is formed by 4 adjacent corners (grid points, pixels). A whole 2D image can be thought as an array of such squares (Fig. 3). For each square, the corner pixels are examined if they are greater than or equal to the threshold. In that case, the respective pixel states are solid (bone), or empty (air) otherwise. There are 16 possible configurations of each square, according to its 4 corners. There is no isovalue point in solid-solid or empty-empty edges of the squares. In solid-empty or empty-solid edges, the position of an isovalue point can be computed by linear interpolation, which is influenced by the given threshold value. In each square, one or more connections of 2 isovalue points generate one or more isovalue lines, which divide the solid and empty portions of the square. The length of the lines can be computed on each 2D square and is used for the computation of surface area in 3-dimensional (3D) MACS. The 2D area of the empty (air) portion can work for a volume of 3D MACS.
Modified SP algorithm
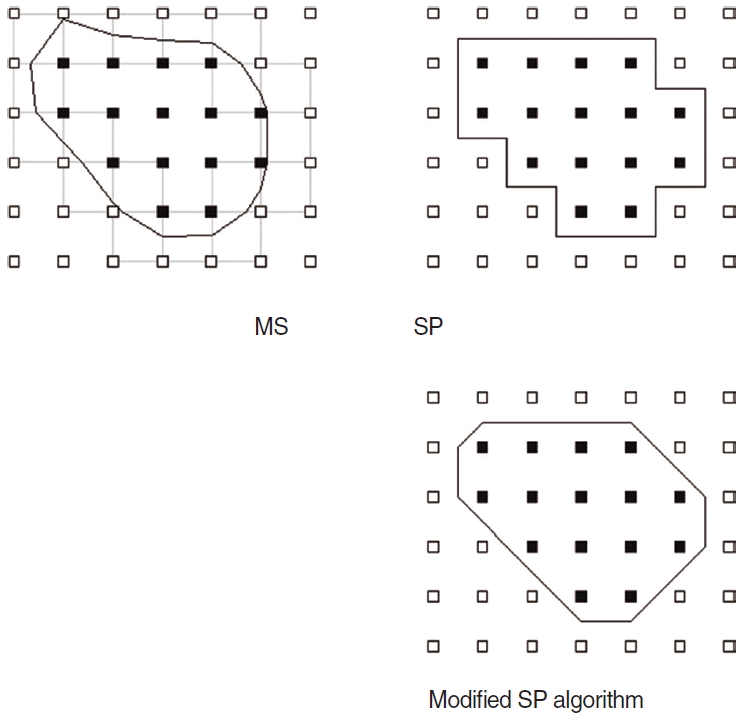
This modification replaces every stairstep border with the shortest line in generated forms by the SP algorithm (Fig. 4). This algorithm was only used for the evaluation of predicted systemic error in surface area of the SP algorithm.

A modified square pixel (SP) based algorithm to minimize predicted systematic error, which overestimates the surface area of mastoid air cell system. Accordingly the marching square (MS) algorithm is used for computation of both volume and surface area, while the original and the modified algorithms are necessary for volume and surface area, respectively, in the SP based algorithm.
Repeating computation of the surface area and volume of the MACS with varying HU threshold
At a given HU threshold, the surface area and volume of the MACS was computed from the DICOM files prepared in the prior step. These computations were repeated with HU thresholds from –700 to 0 at intervals of 50 (–700, –650, –600, … , –50, 0). Previous studies have used only one threshold value, for example HU=–200.
RESULTS
Comparison between the 2 algorithms
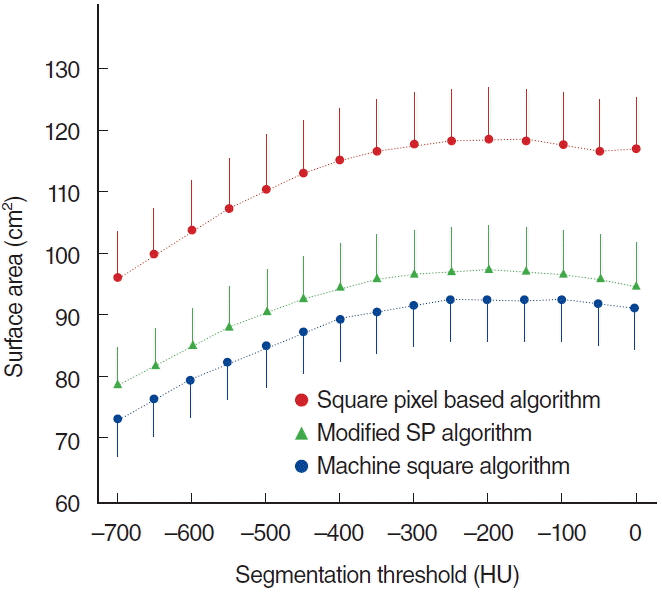
Although the MS algorithm yielded a slightly larger volume in HU threshold range from –50 through 0, SP algorithm showed slightly larger volume in a different range. None of these differences met statistical significance (t-test, P>0.05). The 2 algorithms have yielded similar volumes (Fig. 5). For surface area, SP algorithm computed a significantly (t-test, P<0.05) larger value in all ranges (Fig. 6). This erroneous value of surface area is mainly due to a systematic error in SP algorithm, which could be predicted and will be discussed later.

Volume of mastoid air cell system as calculated by 2 algorithms at a given segmentation threshold from –700 to 0 at intervals of 50. None of the differences of volume at each threshold is statistically significant. Standard errors are drawn to one direction for display simplicity. HU, Hounsfield units.

Surface area of mastoid air cell system by the 2 algorithms with given segmentation thresholds from –700 to 0 at intervals of 50. In addition, the resulting modification (to avoid systematic error) of square pixel (SP) based algorithm is displayed here, and it is explained in the discussion section. HU, Hounsfield units.
Influence of HU threshold variation
The volume of MACS is strongly correlated with segmentation threshold (Fig. 5). The correlation of the surface area of MACS and segmentation threshold is shown in Fig. 6. For HU threshold=–200, the surface area of MACS is 92.6 cm2 (MS algorithm) or 118.3 cm2 (SP algorithm), and the volume is 6.95 cm3 (MS algorithm) or 7.02 cm3 (SP algorithm). The surface area/volume ratio is 13.3/cm (MS algorithm) or 16.9/cm (SP algorithm). The lower HU threshold value was set, the smaller volume was measured. The surface area graph showed a plateau in the HU threshold range from –300 to –100.
Algorithm vs. threshold
In the computation of the MACS volume, the HU threshold had a greater impact than the algorithm did. In HU threshold range from –700 through 0, the difference between the maximum and minimum volume was 44% (SP algorithm) or 47% (MS algorithm).
On the other hand, the algorithm had insignificant effects. In HU threshold=–200, the difference between the maximum (SP algorithm) and minimum (MS algorithm) volume was only 1%. In HU threshold =–700, the difference was 5%.
DISCUSSION
The MACS has been well documented as an air reservoir for the middle ear and as a pressure regulator by gas exchange [1]. On a histological basis, the human mastoid cell structure has features of respiratory epithelium performing the function of gas change. The larger surface area of MACS is the more effective gas exchange is possible [9]. Thus, the level of mastoid pneumatization can be used as a prognostic factor [2,3]. A positive correlation between volume and surface area of MACS has been known [6,10].
The MACS is a very irregular structure and spreads widely in a cone-shaped temporal bone. It is therefore very difficult to measure the size of MACS directly. There have been many reports regarding the measurement of the size of mastoid pneumatization, such as a water-weight method, a pressurized transducer method, and planimetric method [6,9]. However, with the development of radiological tools, many methods that are capable of measuring the volume of the mastoid pneumatization are produced [4,5].
In previous reports that have used common image analysis software, each DICOM file (HU data) was changed to a bitmap file (gray value data), which was strongly influenced by the window center and the window width. Such a mapping process rearranges HU into a 256-point scale and yields degenerated values. In addition, consistent specification of the window center/width is necessary for a proper report. To avoid these drawbacks, we suggest direct use of HU for segmentation threshold.
Recent studies have used 3D image reconstruction techniques, almost all of which are commercial programs [8,9]. However, these programs have not revealed the specific algorithm used for the calculation of volume and/or surface area.
Owing to the diversity or uncertainty of methods used in the measurement of volume and/or surface area of MACS in previous studies, it is difficult to compare data. This can be an obstacle to vigorous study on MACS. Another aim of this study was to suggest a reliable method of measuring the volume and surface area of MACS.
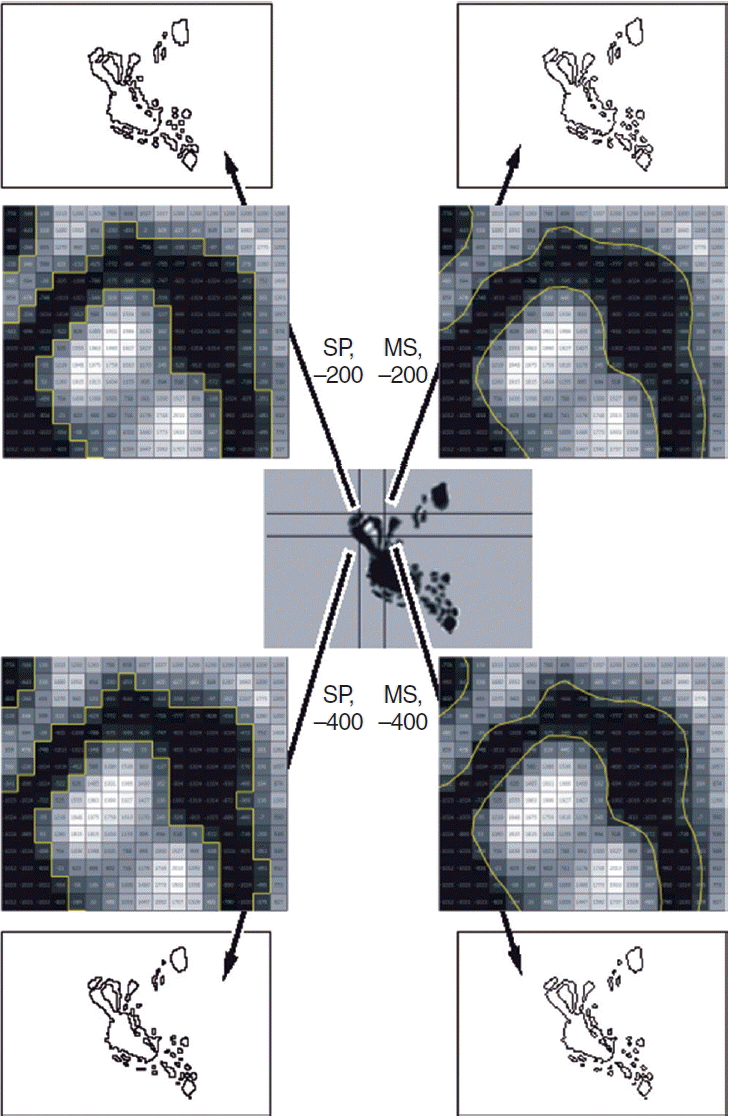
In this study, we showed that the measured volume and surface area of MACS can vary with not only segmentation threshold, but also the algorithm used. While the measured volume increased as HU threshold was set higher, the measured surface area showed peak value around –200 HU, which was explained in Fig. 7. In terms of the algorithms used, in every HU threshold the 2 algorithms (SP and MS algorithms) yielded the volume, the difference of which was not statistically significant. However, the SP algorithm yielded significantly higher surface area than MS algorithms in every HU threshold. In SP algorithm, the border will form a stairstep-like pattern rather than a linear one. We thought that the overestimation of the perimeter was the reason why SP algorithm computed a higher value in surface area than the MS algorithm did. To adjust this systematic error, we modified the SP algorithm, which every stairstep of the border was replaced with the shortest line (Fig. 4). As shown in Fig. 6, the measured surface area by the modified SP algorithm was not different from that by MS algorithm in every HU threshold. Also surface area/volume ratio was reduced from 16.9/cm to 13.8/cm for HU threshold=–200 (MS algorithm, 13.3/cm). Taken together, MS algorithm is thought to be more suitable for measuring volume and surface area of MACS than SP algorithm, modification of which is necessary to avoid systematic error when measuring surface area.

An explanation for the plateau on the surface area graph. In an example of a square which consists of 4 corner pixels having HU of –500, –180, –220, and +20, respectively, the higher the segmentation threshold is set (HU=–400, –200, or –100), the larger the gray area (air area in 2D slice, volume in 3D MACS) will be measured. However, the length of solid line segment (line segment in 2D slice, surface area in 3D MACS) will be the maximum in HU threshold of –200 in this example. HU, Hounsfield units; MACS, mastoid air cell system; 2D, 2-dimensional; 3D, 3-dimensional.
From the pilot data for this study and on some speculation, we suggest that –200 HU is the appropriate threshold for measuring volume and surface area of MACS. When we analyzed the number of pixels according to their HU, there was the inflection point of pixels number around –200 HU (data not shown here). In addition, –200 HU was the frequently used threshold in the previous studies that mentioned the threshold used.
In this study, we observed that the range of volume and surface area of MACS is wide even in subjects with normal middle ears. This large variation should be considered when researchers calculate the sample size to be large enough to perform further studies related to volume and/or surface area of MACS.
In summary, a standard method for measuring volume and surface area of MACS is thought to be necessary for the clear communication among researchers. We suggest MS algorithm and –200 HU of the threshold as a standard method in the measurement of volume and surface area of MACS.
Notes
No potential conflict of interest relevant to this article was reported.
