Disability of Hearing Impairment Is Positively Associated With Urine Albumin/Creatinine Ratio in Korean Adults: The 2011–2012 Korea National Health and Nutrition Examination Survey
Article information
Abstract
Objectives.
The aim of this study was to determine whether chronic kidney disease (CKD) is associated with hearing thresholds in the nationwide, large-scaled Korean population.
Methods.
This study analyzed the data of 9,798 subjects of 19 years and older (4,387 males and 5,411 females). Urine albumin-to-creatinine ratio (ACR) was measured from first-voided spot urine samples. The air-conduction hearing threshold was measured at 0.5, 1, 2, 3, 4, and 6 kHz and pure tone audiogram (PTA) average was calculated as the four-frequency average of 0.5, 1, 2, and 4 kHz.
Results.
Urine ACR was significantly correlated with the PTA average of better ear in both genders, especially at 3 and 6 kHz in males and at 1, 3, 4, and 6 kHz in females. After adjusting, urine ACR also increased the risk of hearing loss in female, especially if urine ACR was 30 mg/g and more (odds ratio, 1.636–2.229. This study showed that the degree of hearing loss was significantly different according to categories of urine ACR in both genders. Hearing loss without disability was found less but that with bilateral hearing disability was found more as urine ACR increased. In generally, prevalence of hearing loss with disability was higher in males than females.
Conclusion.
This study demonstrated that urine ACR was significantly correlated with the PTA average of better ear in Korean adults of both genders. This study suggests that clinicians should carefully monitor the hearing level for subjects with elevated urine ACR, even though high urine ACR within the normal range.
INTRODUCTION
Hearing loss (HL) affects the quality of life significantly and its prevalence is high. As the elderly people increases, it is anticipated that HL will become one of the major public health concerns in the worldwide. The high prevalence of HL infers that a large number of people are at risk of functional and psychosocial disabilities associated with HL.
Several studies [1,2] suggest that metabolic factors contribute to HL. Especially, chronic kidney disease (CKD) is a well-known risk factor for atherosclerosis, and animal studies [3,4] have reported an association between uremia and cochlear dysfunction. Recently, there are two studies regarding the association between CKD and HL. Kang et al. [5] analyzed the data of 16,554 subjects using the 2009–2011 Korean National Health and Nutrition Examination Survey (KNHANES) database and found that CKD was associated with elevated hearing thresholds in men and women. However, they defined CKD as an estimated glomerular filtration rate (eGFR) <60 mL/min/1.73 m2 or a dipstick proteinuria result of ≥1+ at a single measurement. Because repeated measurements of creatinine and proteinuria are needed for a definite diagnosis of CKD, this methodology seems to be not suitable to be a screening test. On the other hand, Shen and Hsieh [6] determined albumin excretion rate by measuring urine albumin-to-creatinine ratio (ACR) in spot urine and suggested that the early detection of albuminuria might be the screening for HL in diabetic patients. However, their cross-sectional study enrolled only 68 cases, which did not remove the confounding bias, including the effect of noise exposure.
Urine ACR, which can be measured from a single urine sample, is used to estimate the albumin excretion rate through the kidney. Urine creatinine excretion is affected by sex, race, age, and muscle mass [7]. Microalbuminuria is considered to be a marker of renal microvascular disease and has conventionally been defined as a urine ACR ≥17–250 mg/g in men and 25–350 mg/g in women in a spot urine sample. These sex-specific cutoff values are almost equal at urine albumin excretion rates of 30 μg/min [8]. However, more recent studies have demonstrated that higher urine ACR, even values within the normal rage, are independently associated with an increased risk for the development of hypertension. Therefore, many researchers have proposed that new definition of microalbuminuria is needed [9-11]. Consequently, an ACR value ≥5 mg/g or an ACR value ≥10 mg/g have adopted as new cutoff values in their analyses [9,12].
The identification of the relationship between HL and CKD will be useful in planning for the early diagnosis and management of HL in patients with CKD. Therefore, the aim of this study was to determine whether CKD is associated with hearing thresholds using urine ACR in the nationwide, large-scaled Korean population. The design of this study thus aimed to evaluate the association between urinary ACR and HL using the 2011–2012 KNHANES database, which is a national surveillance system that has been assessing the health and nutritional status of Koreans since 1998.
MATERIALS AND METHODS
Study design and participants
The KNHANES is a nationwide, population-based, cross-sectional health examination and survey conducted regularly by the Division of Chronic Disease Surveillance, Korea Centers for Disease Control and Prevention, Ministry of Health and Welfare in South Korea. KNHANES was performed in 1998 (I), 2001 (II), 2005 (III), 2007–2009 (IV), 2010–2012 (V), and 2013–2015 (VI). It used a rolling sampling design including a complex, stratified, multistage, probability cluster survey and its sample represented the total noninstitutionalized civilian population of South Korea. A total of 192 sampling units were randomly selected from primary sampling units encompassing the target population. Each sampling unit contained 20 households per sampling unit with a total of 3,800 households surveyed in 1 year. The expected total sample size is based on past KNHANES waves using the response rates for each subdomain of interest. The goal for the overall response rate for the KNHANES is 75%. The survey consisted of three components: a health interview, a nutrition interview, and health examination. All questionnaires were administered either by medical doctors and trained interviewers in person at the mobile examination center and at the participants’ homes. Participants had the right to refuse participation according to the National Health Enhancement Act. All the surveys were conducted with the participants’ informed consent and approved by the Institutional Review Board (IRB) of the Korea Centers for Disease Control and Prevention (IRB No. 2011-02CON-06-C, 2012-01EXP-01-2C, and 2013-07CON-03-4C). Using verbal informed consent protocol, participants were provided with all pertinent information regarding purpose, procedure, potential benefits and alternatives to participation through a study information sheet, and then verbal agreement was obtained from those who wanted to participate in the study [13].
This study was based on the data from KNHANES V-2 (the year 2011) and V-3 (the year 2012). KNHANES V-2, V-3, and VI-1 were conducted by four survey teams. A total of 16,576 individuals with normal tympanic membrane were enrolled but 3,717 subjects younger than 19 years old and 3,061 subjected with missing urine ACR or pure tone audiometry (PTA) data were excluded. Finally, a total of 9,798 subjects aged ≥19 years (4,387 males and 5,411 females) were included into the analysis.
Anthropometry, laboratory measurements, and PTA
Trained medical staff performed the physical examinations according to standardized procedures. Height was measured to the nearest 0.1 cm using a portable stadiometer (seca 225, seca Deutschland, Hamburg, Germany) when participants were standing barefoot. Bodyweight was measured to the nearest 0.1 kg on a balanced scale (GL-6000-20, CAS Korea, Seoul, Korea) while participants wore a lightweight gown. Body mass index (BMI) was calculated as the individual’s weight in kilograms divided by the square of their height in meters. Waist circumference was measured using a measuring tape (seca 200, seca Deutschland) to the nearest 0.1 cm in a horizontal plane at the midpoint between the iliac crest and the costal margin at the end of normal expiration. Blood pressure was measured twice on the right arm at 5-minute intervals using a standard mercury sphygmomanometer (Baumanometer, Baum, Copiague, NY, USA) and recorded as an averaged value. Smoking behavior was classified as current smoker, ex-smoker, or nonsmoker. Heavy alcohol drink was defined as above 30 g/day of ethanol. Moderate physical activity was defined as moderate physical effort that requires somewhat harder than normal breathing for at least 10 minutes at a time. History of explosive or occupational noise exposure was considered positive or negative based on subjects’ recall. An explosive noise was defined as a sudden loud noise such as an explosion or gunshot. Exposure to occupational noise was determined by whether the participant had worked in a location with loud machines for ≥3 months. Loud noise was defined by whether the participant had to raise his or her voice to hold a conversation.
After overnight fasting, blood samples were obtained from participants’ antecubital veins. The concentration of glucose was measured using a Hitachi automatic analyzer 7600 (Hitachi, Tokyo, Japan). The levels of glycated hemoglobin (HbA1C) were measured using high-performance liquid chromatography. The eGFR was calculated using an abbreviated equation; estimated GFR (mL/min/1.73 m2) = (140 – age in years) × weight in kilogram/0.814 × serum creatinine. CKD was defined as an eGFR of <60 mL/min/1.73 m2. Urine albumin/creatinine ratio (ACR) was measured from first-voided spot urine samples. This study stratified the subjects according to urine ACR as ≥30 mg/g, ≥20 and <30 mg/g, ≥10 and <20 mg/g, ≥5 and <10 mg/g, and <5 mg/g.
Ear examinations were performed by otorhinolaryngology residents by using a 4-mm endoscope (Xion GmbH, Berlin, Germany) and the ML 150 vision system (JRMED Trade Co., Seoul, Korea). The air-conduction hearing threshold was measured by well-trained examiners in a double-walled, sound-proof booth by using an automatic audiometer (SA-203, Entomed, Malmo, Sweden) at 0.5, 1, 2, 3, 4, and 6 kHz. In this study, the PTA average was calculated as the four-frequency average of 0.5, 1, 2, and 4 kHz in dB HL (decibel hearing level). Because the hearing threshold of both ears was asymmetric in most subjects, the PTA average was categorized as class 1 (less than 40 dB HL in both ears; no hearing disability), class 2 (40 dB HL and worse in either of both ears; unilateral hearing disability), and class 3 (40 dB HL and worse in both ears; bilateral hearing disability). The PTA average of 40 dB HL was chosen as the criteria because it is serviceable hearing level.
Statistical analysis
All continuous variables are presented as means and standard deviations. All categorical variables are presented as percentages. One-way ANOVA and chi-squared tests were used to compare mean values for continuous variables and percentages for categorical variables, respectively, according to the subgroups of HL. The odds ratios (ORs) and corresponding 95% confidence intervals for the risk of HL were calculated using weighted multivariate logistic regression analyses. All analyses were performed using SAS ver. 9.3 (SAS Institute Inc., Cary, NC, USA). All statistical tests were two-tailed and the P-value for statistical significance is defined as P<0.05.
Ethics statement
This study was approved by the IRB of Uijeongbu St. Mary’s Hospital (IRB policy No. UC15EISI0055), which waived the need for informed consent, as the subjects’ records and information were anonymized and de-identified prior to the analysis.
RESULTS
Descriptive data
The characteristics of the study participants are summarized in Table 1. In this study, the subjects were classified into three classes; class 1 (less than 40 dB HL in both ears), class 2 (40 dB HL and worse in either of both ears), and class 3 (40 dB HL and worse in both ears). Bellows were significantly different among three classes of the HL in males as well as females; age, education level, hypertension, metabolic syndrome, BMI, fasting plasma glucose, HbA1c, GFR, CKD, and urine ACR. Age was oldest in class 3, followed by class 2, and then class 1 (P<0.001 in both genders). The higher education level more than high-school was least in class 3, followed by class 2, and then class 1 (P<0.001 in both genders). Hypertension showed the highest prevalence in class 3, followed by class 2, and then class 1 (P<0.001 in both genders). Metabolic syndrome showed the highest prevalence in class 3, followed by class 2, and then class 1 (P=0.003 in males and P<0.001 in females). HbA1c was highest in class 3, followed by class 2, and then class 1 (P<0.001 in both genders). The eGFR was lowest in class 3, followed by class 2, and then class 1 (P<0.001 in both genders). CKD was found most in class 3, followed by class 2, and then class 1 (P<0.001 in both genders). We did not find out any trend of BMI and fasting plasma glucose even though they were significantly different among three classes of the HL.

Baseline characteristics of 9,788 participants in this study
The presence of current smoking was significantly different among three classes of the HL in males only; it was least in class 3, followed by class 2, and then class 1 (P=0.003). On the hand, bellows were significantly different among three classes of the HL in females only. Heavy alcohol drinker was found least in class 3, followed by class 2, and then class 1 (P=0.002). Exposure of explosive noise was reported most in class 3, followed by class 2, and then class 1 (P<0.001). Waist circumference was largest in class 3, followed by class 2, and then class 1 (P<0.001).
Log of urine ACR was highest in class 3, followed by class 2, and then class 1 (P<0.001 in both genders). There were significant differences in 5 categories of urine ACR among three classes of the HL in males as well as females (P<0.001 in both genders). For each category of urine ACR, ACR was highest in class 3, followed by class 2, and then class 1.
Association between urine ACR and PTA average of better ear at specific frequency
In most subjects, both hearing levels were similar but there were a lot of subjects with unilateral or asymmetrical HL. To solve this problem, we chose the PTA average of better ear as the representative hearing level of a subject.
Table 2 showed the association between urine ACR and PTA average of better ear at specific frequency. At each of all frequencies, urine ACR was significantly correlated with the PTA average of better ear in both genders, even though its correlation was not strong. Especially, its correlation was higher at 3 and 6 kHz in males and at 1, 3, 4, and 6 kHz in females.
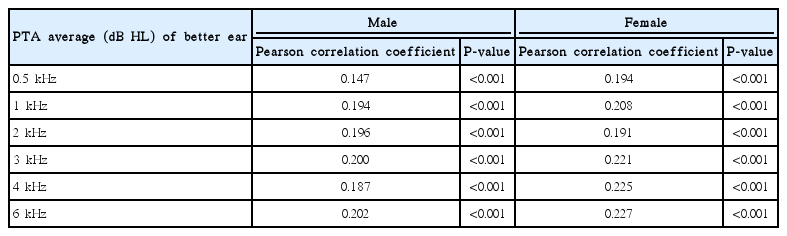
Linear regression analysis of the association between urine albumin/creatinine ratio and PTA average of better ear at specific frequency
Association between urine ACR and subclasses of the hearing loss
We next performed weighted logistic regression analyses to examine whether increased urine ACR is associated with a higher risk of HL (Table 3). In age and BMI-adjusted models, urine ACR increased the risk of HL in female subjects with HL (≥30 mg/g: OR, 1.674; 95% CI, 1.200 to 2.336 / ≥20 and <30 mg/g: OR, 1.614, 95% CI, 1.014 to 2.570 / ≥10 and <20 mg/g: OR, 1.416; 95% CI, 1.020 to 1.965) as well as with bilateral HL (≥30 mg/g: OR, 2.065; 95% CI, 1.346 to 3.166 / ≥10 and <20 mg/g: OR, 1.689; 95% CI, 1.028 to 2.775). After adjusting for age, BMI, smoke, alcohol, physical activity, education, and income, urine ACR increased the risk of HL in female subjects with HL (≥30 mg/g: OR, 1.612; 95% CI, 1.146 to 2.266 / ≥20 and <30 mg/g: OR, 1.601; 95% CI, 1.002 to 2.558) as well as with bilateral HL (≥30 mg/g: OR, 2.202; 95% CI, 1.410 to 3.440). After adjusting for age, BMI, smoke, alcohol, physical activity, education, income, stress and metabolic syndrome, urine ACR also increased the risk of HL in female subjects with HL (≥30 mg/g: OR, 1.674; 95% CI, 1.180 to 2.375 / ≥20 and <30 mg/g: OR, 1.636; 95% CI, 1.017 to 2.633) as well as with bilateral HL (≥30 mg/g: OR, 2.229; 95% CI, 1.407 to 3.531).
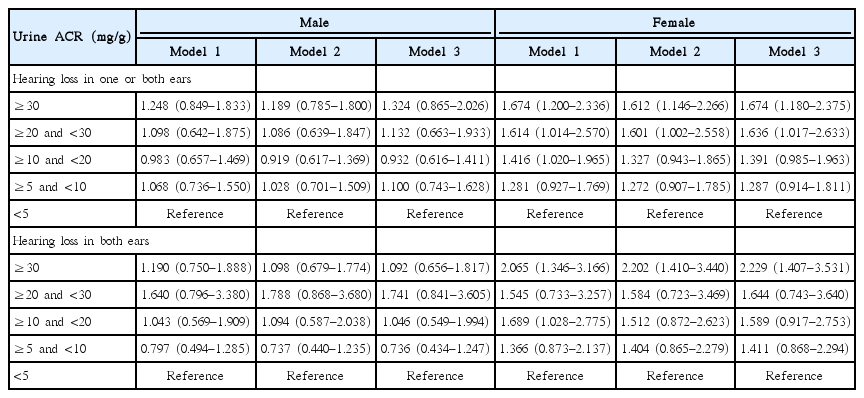
Logistic regression of urine ACR and hearing loss. Regression models and odds ratio in subjects with hearing loss in one or both ears
Prevalence of the hearing loss in 5 categories urine ACR
Fig. 1 demonstrated that the degree of HL was significantly different according to categories of urine ACR in males and females (P<0.001 in both genders). The class 1 of HL without hearing disability was found less as urine ACR increased and the class 3 of HL with bilateral hearing disability was found more as urine ACR increased. These trends were found in males and females. However, general prevalence of class 2 and 3 was higher in males than females.

Relationships between the categories of urine albumin-to-creatinine ratio (ACR) and prevalence of hearing loss according to gender. The degree of hearing loss was significantly different according to categories of urine ACR in males and females subgroups (P<0.0001 in both subgroups).
DISCUSSION
This is the nationwide study to demonstrate a significant relationship between urine ACR and HL. Several researchers have made their effort to evaluate the metabolic factors contributing to HL. Diaz de Leon-Morales et al. [14] compared the data of 94 patients with type 2 diabetes mellitus and 94 age- and sex-matched controls and found that type 2 diabetes mellitus was associated with subclinical high frequency HL. Using the data of 1999–2004 National Health and Nutrition Examination Survey in the United States, Bainbridge et al. [15] reported type 1 and 2 diabetes mellitus was associated with higher occurrence of HL in adults. Lerman-Garber et al. [16] compared the data of 46 patients with early-onset type 2 diabetes mellitus and 47 age-matched controls and concluded that early-onset type 2 diabetes mellitus increased the prevalence of subclinical HL. Shen and Hsieh [6] analyzed the data of 68 patients with type 2 diabetes and reported that increased albuminuria was positively associated with the severity of HL among patients with type 2 diabetes. Abd El Dayem et al. [17] analyzed the data of 40 patients with type 1 diabetes mellitus and 40 controls in cross-sectional observational study and reported that type 1 diabetes mellitus was associated with high/extended high frequency HL in children. Konrad-Martin et al. [18] analyzed the cross-sectional data of peripheral and central auditory function data from the longitudinal study of Veterans and revealed the significant effects of disease severity on the hearing in patients with type 2 diabetes.
In Korea, the similar researches have been conducted using the database of the KNHANES. KNHANES is a nationally representative cross-sectional, multi-stage stratified survey of a representative sample of the entire population in South Korea and conducted by the Korea Centers for Disease Control and Prevention based on the National Health Promotion Act. It includes about 10,000 individuals each year as the survey sample and collects information on socioeconomic status, health-related behaviors, quality of life, healthcare utilization, anthropometric measures, biochemical and clinical profiles for noncommunicable diseases and dietary intakes with three component surveys: health interview, health examination, and nutrition survey. Kang et al. [19] analyzed the data of 3,253 adults between 50 and 80 years old using the 2011 KNHANES database and found that dietary intake of vitamin C was associated with better hearing in the older population. Kang et al. [5] analyzed the data of 16,554 subjects of the 2009–2011 KNHANES database and concluded that metabolic syndrome was associated with increased hearing thresholds in women, and CKD was associated with increased hearing thresholds in men and women. Hong et al. [20] analyzed the data of 16,040 subjects aged 19 years or older using the 2010–2012 KNHANES database and revealed that hypertension, diabetes, smoking, increased serum cholesterol, and decreased eGFR were the risk factors of HL in Korean adults. Lee et al. [21] compared the data of 324 patients with sudden HL and 972 subjects with normal hearing from the 2009–2012 KNHANES database. They revealed that high total cholesterol, high triglycerides and high BMI were significantly associated with the prevalence of sudden HL and suggested that vascular compromise might play an important role in the pathogenesis of sudden HL.
The strengths of this study were that this study was a population-based study and that urine ACR was evaluated as an indicator of CKD. Kang et al. [5] reported that CKD was associated with elevated hearing thresholds in Korean but they used eGFR estimated from serum creatinine level or dipstick result as a diagnostic tool for CKD. Recent clinical guideline warns that serum creatinine alone should not be used to estimate kidney function and recommend that eGFR is more accurate than serum creatinine alone. Two key markers for CKD have been urine albumin and eGFR. Because eGFR varies according to age, sex, race, and body size, eGFR is not reliable. Contrary to eGFR, albuminuria is used to diagnose and monitor kidney disease and 24-hour urine albumin excretion is well estimated by urine ACR, which in a spot urine sample is the recommended method to evaluate albuminuria and the risk for CKD progression. There are three categories of albuminuria using urine ACR: category A1 is urine ACR <30 mg/g, A2 is 30–300 mg/g, and A3 is >300 mg/g. A2 and A3 are defined as microalbuminuria and macroalbuminuria, respectively. Even though A1 is defined as normal ACR, this study classified category A1 into four subgroups of ≥20 and <30 mg/g, ≥10 and <20 mg/g, ≥5 and <10 mg/g, and <5 mg/g. This is because many reports demonstrated that high ACR within the normal range is associated with other diseases [22-24].
Other strength of this study was that we focused on the subclinical albuminuria. This study showed that increased risk of HL was associated with increased urine ACR in subjects with abnormal urine ACR (categories A2 and 3 of albuminuria). In addition, this study demonstrated that increased risk of HL was also associated with increased subclinical ACR in subjects with categories A1 of albuminuria. Increased subclinical ACR has been reported to be a risk factor for several diseases. Microalbuminuria is an indication of vascular dysfunction, an independent risk factor for cardiovascular disease, and one of the earliest indicators of kidney injury [25,26].
Other strength of this study was the criteria of a HL. In this study, 40 dB HL of 4-frequency average PTA was chosen as the criteria for the HL even though normal hearing level is within 25 dB HL. This was because 40 dB HL has been world-widely accepted as a serviceable hearing level, which determines actual hearing disability of a hearing-impaired individual. To solve the problem of asymmetric HL in most subjects, we categorized the PTA average into three classes, based on the PTA average of better ear [27].
The present study is the large-scaled cross-sectional analysis in Korean population to demonstrate the association between urine ACR and HL. However, it also has a number of limitations. First, it was a cross-sectional study, which did not evaluate the changes in a hearing level. Therefore, further prospective analysis is needed to confirm whether there is a casual relationship between urine ACR and HL. Second, this study measured only the PTA average, which means the ability to hear a sound. We did not evaluate other important psychoacoustic components of HL, such as speech discrimination, which means the ability to discriminate a word. In addition, the KNHANES examined only air conduction threshold but not bone conduction threshold for a hearing level. Third, this study could not completely rule out the possibility of congenital, age-related, autoimmune or idiopathic sudden HL.
In conclusion, this study using the data of the 2011–2012 KNHANES revealed that hypertension, metabolic syndrome and CKD were associated with the HL in Korean adults. This study demonstrated that urine ACR was significantly correlated with the PTA average of better ear in Korean adults of both genders. This study suggests that clinicians should carefully monitor the hearing level for subjects with elevated urine ACR, even though increased subclinical range of urine ACR.
HIGHLIGHTS
▪ Association between chronic kidney disease and hearing impairment was examined from the population-based Korean National Health and Nutrition Examination Survey (KNHANES) data.
▪ Hypertension, metabolic syndrome, and chronic kidney disease were associated with hearing loss.
▪ Hearing level should be monitored for subjects with elevated urine albumin-to-creatinine ratio.
Notes
No potential conflict of interest relevant to this article was reported.