Serum Uric Acid Relation for Hearing Threshold Shift
Article information
Abstract
Objectives
The effects of serum uric acid (UA) level on a variety of diseases were found from experimental and observational studies via oxidative stress and anti-oxidants. However, research on the association of UA and hearing thresholds is relatively sparse. We investigated this issue in the U.S. general population to evaluate the relationship of serum UA levels and pure tone threshold of hearing.
Methods
Forty four thousand eighty four eligible participants aged 20 to 69 years who have serum UA data and received Audiometry Examination Component were enrolled from the National Health and Nutrition Examination Survey 1999–2004. Hearing thresholds (dB) as a pure tone average at low frequencies (0.5, 1, 2 kHz) and at high frequencies (3, 4, 6, and 8 kHz) were computed. Multivariate linear regression models and tertile-based analysis with an extended-model approach for covariates adjustment were used to assess the correlation between serum UA level and hearing thresholds.
Results
In the adjusted mode of tertile-based analysis, the regression coefficients elucidated as the change of log-transformed mean hearing thresholds upon comparing participants in the highest tertile of serum UA to those in the lowest tertile were –0.067 (P=0.023) in high frequency and –0.058 (P=0.054) in low frequency. After adjusting for multiple pertinent covariates, inverse association between tertiles of serum UA and hearing thresholds remained essentially unchanged. The negative trends between serum UA and hearing thresholds were statistically significant (P for trends <0.05) in tertile-based multiple linear regressions.
Conclusion
Individuals with elevated UA levels independently were found to be inversely associated with hearing thresholds for pure tone audiometry in a nationally representative sample of U.S. adults.
INTRODUCTION
Uric acid (UA), the final breakdown product of dietary or endogenous purine metabolism in humans and principal constituents of DNA, RNA, and cellular energy stores, has been speculated to play a role of anti-oxidation, even though it remains debatable that the relative momentousness of UA as antioxidant in vivo [1]. Although a great many epidemiologic and observational investigations have reported a relation between the higher serum UA levels and several diseases including hypertension, progressive renal disease [2,3], cardiovascular disease, stroke [4,5], diabetes mellitus [6], insulin resistance and metabolic syndrome [7], little empirical evidence has been found to establish causal relationship. In addition, serum UA levels in humans and primates are higher and more variable than in any other animals, proposing to keep an elevated level of UA connected between some important biological benefits via a potent natural selection course [8]. Apart from these latent detrimental influences, some researches have speculated that UA might have anti-oxidative effect to cognitive function [9], multiple sclerosis [10], Parkinson’s disease [11], and Alzheimer’s disease [12] via neuroprotection. We hypothesized that uric acid had the neuroprotective effect to hearing thresholds as other neurological diseases. There is little available research on the interaction between serum UA and hearing thresholds of pure tone audiometry. The findings discussed previously prompted us to examine the issue using the dataset from the National Health and Nutrition Examination Survey (NHANES), 1999–2004.
MATERIALS AND METHODS
Study population
The NHANES, designed by National Center for Health Statistics of Centers for Diseases Control and Prevention, was a continuing series of stratified, multi-stage, cross-sectional and population-based surveys to assess the health, functional and nutritional status of non-institutionalized adults and children in the U.S. Half of participants who aged 20–69 years in 1999–2004 of NHANES who randomly underwent Audiometry Examination Component at Mobile Examination Center (MEC) were enrolled. A total of 5,742 participants were eligible for inclusion in the audiometric examination initially. Participants who used hearing aids that could not be removed for testing or who could not tolerate test headphones and those with missing information of serum UA levels were excluded. Finally, there were 4,484 persons enrolled in the final analysis.
Audiometric measurement
A trained examiner performed audiometry examination and obtained air conduction from both ears in a sound-isolated chamber through using an audiometer (AD226, Interacoustic, Assens, Denmark) with standard TDH-39P earphones and insert earphones (EARTone 3A) [13]. Pure tone air conduction thresholds were measured for each ear at 0.5, 1, 2, 3, 4, 6, and 8 kHz over an intensity range of –10 to 120 dB. The pure tone average (PTA) of hearing thresholds (in dB) at three low frequencies (0.5, 1, and 2 kHz) was defined as low-PTA, while the PTA of hearing thresholds at four high frequencies (3, 4, 6, and 8 kHz) was classified to high-PTA. We selected PTA in the worse ear for the further analysis.
Data collection and covariates
Pertinent demographic and clinical information, including age, gender, race (including non-hispanic white, non-hispanic black and others), systolic blood pressure, body mass index, smoking status, and medical history including diabetes mellitus, stroke and heart disease, were collected in the home prior to the health examination. The average of three blood pressure determinations obtained on all eligible individuals was used by a mercury sphygmomanometer. Body mass index (BMI) was calculated as weight in kilograms divided by the square of height in meters. Smoking status was defined based on a question “Do you now smoke cigarettes?” Diabetes mellitus was classified based on a question “Other then during pregnancy, have you ever been told by a doctor or health professional that you have diabetes or sugar diabetes?” Other medical history such as stroke or heart disease was categorized by question such as “Has a doctor or health professional ever told you that you have stroke (or coronary heart disease, or angina/angina pectoris)?” Noise exposure was classified based on a question “Loud job noise, ever exposure, 3 months?” Serum UA was measured by oxidization with the specific enzyme uricase to form allantoin and H2O2 (Hitachi 704 Analyzer, Roche Diagnostics, Indianapolis, IN, USA). Biochemical analyses of triglycerides and high-density lipoprotein cholesterol (HDL-C) (Hitachi 704 Analyzer; Roche Diagnostics, Indianapolis, USA) were performed by the Lipoprotein Analytical Laboratory at Johns Hopkins University, Baltimore, Maryland. All protocols followed standardized methods that had documented accuracy with respect to Centers for Disease Control and Prevention (CDC) reference methods [14].
Statistical analyses
Some covariates were treated as continuous variables, such as age, systolic blood pressure, BMI, triglyceride, high-density lipoprotein cholesterol, and some were treated as categorical variables, such as sex, race, smoking, and history of heart disease, diabetes mellitus, stroke, and noise exposure. Characteristics of participants were compared using ANOVA test for continuous variables and chi-square tests for categorical test. Subjects were divided into tertiles based on the level of serum UA levels. After the log transformation of hearing thresholds tends to normalize their distribution, linear regression was used in multivariate analyses examining the association. Due to hearing thresholds without normality, natural log-transformed was performed before regression analysis. The regression coefficients were elucidated as the change of log-transformed mean high and low tone hearing thresholds for pure tone audiometry for each serum UA level increment upon comparing participants in the highest tertile of serum uric acid to those in the lowest tertile. Models were used for pertinent covariates adjustment as follows: Model 1=age, sex, and race; Model=Model 1+triglycerides, high density lipoprotein cholesterol, BMI, and systolic blood pressure; Model 3=Model 2+smoke, history of heart disease, diabetes mellitus, stroke and noise exposure. Serum UA levels were treated tertiles of from T1 to T3 as continuous variable assessed trends tests, which to observe the associations cross increasing tertiles of serum uric acid and hearing threshold. All analyses were conducted using SPSS ver. 18.0 (SPSS Inc., Chicago, IL, USA). Two-sided P-values of less than 0.05 were considered statistically significance.
Ethics statement
The National Center for Health Statistics Institutional Review Board approved the NHANES study protocol and written informed consent was required before beginning the survey.
RESULTS
Clinical characteristics of participants
A total of 4,484 participants were enrolled in the NHANES dataset from 1999 to 2004. The population’s mean age was 41.01±12.99 years and the mean serum UA was 5.24±1.44 mg/dL. Forty-seven point seven percent (47.7%) of the participants were men. Demographic, clinical and biochemical characteristics of the study population stratified according to serum UA tertiles are shown in Table 1. Compared to subjects in the lower tertiles of UA levels, those with the tertile 3 were older, more likely to be male and higher percentages of heart disease and noise exposure; they were also more likely to have higher systolic blood pressure, BMI, triglyceride, and lower HDL. Hearing thresholds were also found to increase with increasing UA tertiles.
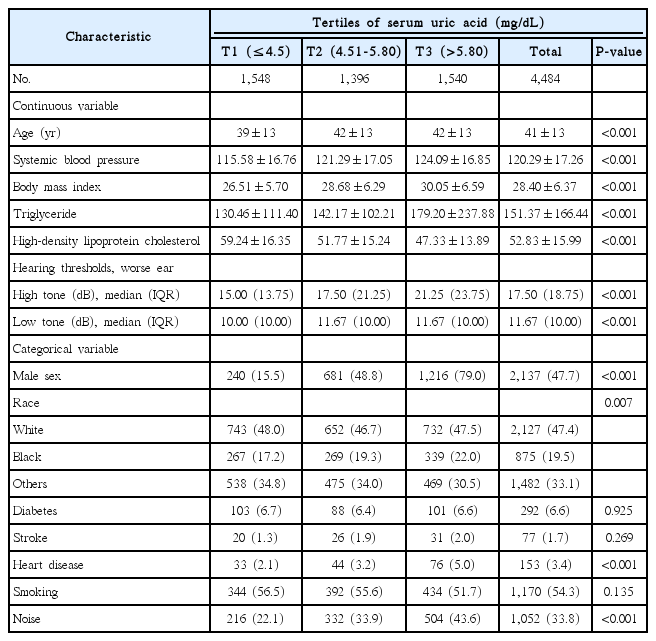
Characteristics of the participants by tertiles of serum uric acid
Association between serum UA level and hearing threshold shift
We examined the relationship of hearing thresholds at a high/low frequency of pure tone audiometry and serum UA tertiles. The results of tertile-based multiple linear regression analysis showed in Table 2. In the adjusted mode of tertile-based analysis, the regression coefficients elucidated as the change of log-transformed hearing thresholds upon comparing subjects in the upper two tertiles of UA levels to those in the lowest tertile were –0.062 (P=0.026) and –0.067 (P=0.023) in high frequency and –0.056 (P=0.046) and –0.058 (P=0.054) in low frequency. After adjusting for multiple pertinent covariates, inverse association between tertiles of UA levels and hearing thresholds remained essentially unchanged. The negative trends between hearing thresholds and UA levels were statistically significant (P for trends <0.05) in tertile-based multiple linear regressions.
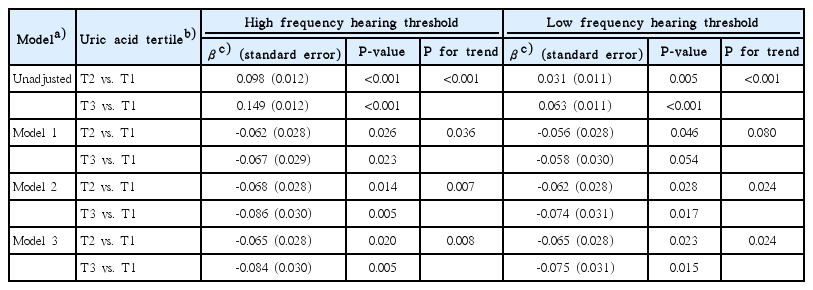
Association between uric acid tertile and high frequency hearing thresholds
DISCUSSION
In a nationally representative sample of the US population, the present study examined the correlation between serum UA levels and hearing thresholds among adults aged 20–69 years. Our findings indicated that higher serum UA was inversely associated with hearing thresholds of pure tone audiometry measurement. The level of serum UA was independently associated with threshold shift in hearing.
UA is the end product of purine metabolism, and sustained hyperuricemia predisposes individuals to develop clinical manifestations, including gouty arthritis, urolithiasis, and renal dysfunction. However, UA is also thought to be a potent antioxidant that effectively scavenges reactive oxygen and reactive nitrogen species, accounting for up to 60% of the free radical scavenging activity in human blood [8,15]. Increased level of reactive oxygen species (ROS) may be involved in inner ear hair cell damage and death in animal models including exposure to noise and to drugs and in some human cases of genetic hearing loss, presbycusis, and Meniere’s syndrome [16]. ROS are account for direct cellular damage to cellular lipid, protein, and DNA, triggering death either through stimulation of gene expression associated with apoptosis or necrosis and may also diffuse among the inner ear scale [17,18]. Increasing antioxidant supplement in the cochlea may effectively prevent hair cell damage and hearing loss in an animal study [19]. Thus, decreased UA levels may reduce the ability of the body to prevent ROS from acting on cellular components and damaging the cell [20]. From research works, UA appears to play a double role as pro-oxidants (primarily within the cell) and anti-oxidants (primarily in plasma) [21,22]. In the view of pro-oxidants, intracellular uric acid generally imposes the harmful effects in animal model and cultured cells of hyperuricemia, such as in vascular, renal, liver cells, and adipocytes; in the aspect of anti-oxidants, uric acid serves as anti-oxidant only in the hydrophilic surroundings of biological fluids. However, it losses the ability to scavenge lipophilic radicals, and the radical chain propagation can not be broken within lipid membrane [23]. The microenvironment in different compartment of human organism could determine the regulation of molecular switch of cardiovascular, renal, and metabolic disease [22]. The apparent dilemma between protective and detrimental influences of UA is supported by clinical evidence that antioxidant properties may become pro-oxidant properties in certain situations, particularly when they are present in blood at abnormally high levels [24]. In the randomized double-blind placebo-controlled trials, administration of uric acid improves endothelial function and decreases free radical activity by selectively restoring nitric oxide bioavailability and increases antioxidant capacity [25,26]. Although the protective mechanisms of hearing threshold shift are still unclear, high UA level provides a certain level of protection possibly through reduction of ROS.
There are some clinical evidences that suggest that low UA levels are associated with the development and progression of a variety of neurological diseases, such as multiple sclerosis (MS), Parkinson’s disease (PD), Alzheimer’s disease (AD), and optic neuritis [20]. In the setting of MS, significantly lower levels of uric acid in blood of these patients as compared with patients with other neurological diseases [10]. It is possible that decreased uric acid levels are attributed to its oxidation by peroxynitrite and formation of allantoin. A longitudinal cohort study demonstrated that higher UA concentration was associated with a significant decreased risk of PD [27]. It might be via antioxidant and iron-chelating properties. Kim et al. [12] showed significant reductions in serum UA level in AD patients compared to those of the healthy group. It supported the hypothesis that oxidative injuries could be an important role in the pathogenesis of AD. Thus, we postulated UA exert neuroprotective effects against hearing sensitivity via its antioxidant capacities.
Our study had several limitations. First, we did not verify the factors that affected serum UA concentration, such as purine food consumption, uric acid excretion rate, and metabolite of UA. Second, our study was only partially reflecting the real amount of serum UA stored in peripheral tissues, not in inner ear perilymph fluid based on serum UA levels. Third, the cross-sectional design precludes direct causal inferences, and the longitudinal relationship between serum UA and hearing sensitivity cannot be ascertained, because serum UA and the pertinent clinical variables were measured only once at enrollment.
In conclusion, our study highlighted that higher serum UA is associated with better hearing sensitivity in U.S. adults and prompts postulation of a potential protective effect of UA on hearing. It was an important hint for clinicians that high serum uric acid levels may help slow progression of hearing loss and decreased susceptibility for developing subclinical hearing impairment. Further investigations are needed to understand whether such mechanisms contribute to the relationship to serum UA with hearing sensitivity and the Janus-face UA to define molecular mechanism that how to activate membranous and intracellular oxidative stress which is incompletely comprehensive.
HIGHLIGHTS
▪ Association between serum uric acid (UA) and hearing threshold was investigated form the US National Health and Nutrition Examination Survey.
▪ Higher UA is associated with better hearing sensitivity.
▪ UA prompts postulation of a potential protective effect on hearing.
▪ UA may decrease susceptibility for developing subclinical hearing impairment.
Notes
No potential conflict of interest relevant to this article was reported.