The Effects of Air Pollutants on the Prevalence of Common Ear, Nose, and Throat Diseases in South Korea: A National Population-Based Study
Article information

Abstract
Objectives
The effects of air pollutants on upper airway disease development have been seldom studied. In this study, we evaluated the effects of air pollution on the prevalence of ENT diseases.
Methods
We identified cases of ENT disease occurring in 2009, as recorded by the Korea National Health and Nutrition Examination Survey, and explored their associations with the levels of five air pollutants: sulfur dioxide (SO2), nitrogen dioxide (NO2), ozone (O3), carbon monoxide (CO), and particulate matter (PM10 particles; particulates ≤10 μm in aerodynamic diameter). Subjects diagnosed with at least one of the five studied ENT diseases were included in analysis, but those aged under 19 years were excluded. Linear associations between ENT disease frequency and pollutant levels were evaluated by calculating Spearman correlations. After adjusting for age, gender, and geographic region, multivariate logistic regression was used to obtain odds ratios (OR) with 95% confidence intervals (CI).
Results
A total of 7,399 subjects with ENT diseases were identified. A linear association was evident between PM10 concentration and the frequency of septal deviation (Spearman coefficient, 0.507; P=0.045). After adjustment, the PM10 level was associated with high odds ratios for chronic rhinosinusitis (1.22; 95% CI, 1.02 to 1.46) and septal deviation (1.43; 95% CI, 1.22 to 1.67). Both of these conditions were more prevalent in males.
Conclusion
We found that increased ambient concentrations of PM10 particles were clearly associated with increased the risk of chronic rhinosinusitis and septal deviation; the exposure-response relationship was definitive.
INTRODUCTION
Air pollution is a recognized risk factor for several diseases and health conditions. Several studies have shown relationships between lower respiratory tract disease frequency and air pollutant levels. In developing countries, at least 42% of all lower respiratory tract infections are attributable to air pollution [1]. Infections of the upper respiratory tract are both common and serious [2]. The upper respiratory tract is the first region of the respiratory system to come into contact with air pollutants; upper respiratory infections influence the status of the lower respiratory tract, inducing morbidity therein and creating considerable economic burdens [2]. However, the relationship between upper respiratory tract infection frequency and the levels of air pollutants remains poorly understood.
Some studies have revealed associations between air pollution levels and ENT diseases; one study found a relationship between air pollutant levels and olfactory dysfunction [3], while others found a relationship with allergic rhinitis [4,5]. Although the cited works showed that air pollution influenced ENT health, systematic research has instead emphasized the effects of air pollution in general; works focusing on ENT conditions in adults are uncommon. The objective of the present study was to analyze relationships between ambient air pollutant levels and the prevalence of various ENT diseases.
MATERIALS AND METHODS
Air pollution
Every year, the Korean National Institute of Environmental Research makes regional air pollution data freely available in a variety of formats on the AirKorea website (http://www.airkorea.or.kr/eng/stationInformation?pMENU_NO=158); we used the 2009 data in the present study. The data were collected from 251 locations in 79 areas of South Korea, and are presented according to administrative region. The hourly concentrations of particulate matter (PM) ≤10 μm according to its aerodynamic diameter (PM10; μg/m3), and nitrogen dioxide (NO2; ppm), ozone (O3; ppm), sulfur dioxide (SO2; ppm), and carbon monoxide (CO; ppm) concentrations were recorded. PM10 values were measured using a beta-ray absorption method and NO2 was measured using a chemiluminescence assay. O3 was assayed by ultraviolet photometry, SO2 by pulsed ultraviolet fluorescence, and CO using a nondispersive infrared method.
Study sample
The Korea National Health and Nutrition Examination Survey (KNHANES) has been conducted in South Korea since 1988 by the Korea Centers for Disease Control and Prevention to investigate prevalence and potential control of a variety of diseases. We used the 2009 data, which were the first to include information on the presence or absence of otorhinolaryngology diseases including allergic rhinitis, chronic otitis media, laryngeal disease, chronic sinusitis, and septal deviation.
Of the total of 10,065 individuals who participated in the health survey and underwent medical check-ups including ENT inspections, we excluded those who were under 19 years of age (n=7,527) and those who did not have at least one of five ENT diseases (chronic otitis media, chronic rhinosinusitis, allergic rhinitis, septal deviation, and benign laryngeal disease) (n=128). Finally, a total of 7,399 individuals were analyzed. The KNHANES was conducted after approval was obtained from the Institutional Review Board of the Korea Centers for Disease Control and Prevention (approval No. 2009-01CON-03-2C).
ENT evaluation
ENT diseases were diagnosed by trained residents. Chronic otitis media was diagnosed in those with tympanic membrane perforations and/or cholesteatoma, including retraction pockets, but not in those with congenital cholesteatoma and/or otitis media with effusion, including patients into whom ventilation tubes had been inserted. Chronic rhinosinusitis was diagnosed in those with nasal polyps evident endoscopically or with at least two of the following symptoms: anterior/posterior nasal drip, nasal obstruction, facial pain/tenderness, and olfactory dysfunction more than 3 months in duration (either an anterior/posterior nasal drip or nasal obstruction was required as a presenting symptom). Allergic rhinitis was diagnosed in those with at least two of the following four symptoms: sneezing, rhinorrhea, nasal obstruction, and itching during the past year. Septal deviation was diagnosed in those in whom endoscopy revealed that the septum was asymmetrically displaced to either the left or right. The endoscopy exams were performed by experienced otorhinolaryngology residents. To enhance the objectivity of diagnosis for septal deviation, the endoscopic exam was performed after nasal mucosa constriction using an epinephrine spray. In the case of a C-shaped septal deviation, the side with the narrower nasal cavity was checked; for an S-shaped septal deviation, both sides were checked.
Benign laryngeal disease was diagnosed in those exhibiting at least one of the following findings on laryngoscopy: a vocal cord nodule/polyp/cyst, Reinke’s edema, vocal cord palsy, contact granuloma, sulcus vocalis, vocal keratosis, an epiglottal cyst, laryngitis, and/or a laryngeal papilloma.
Statistical analysis
All KNHANES data were derived using a stratified, multi-stage, clustered probability sampling method to ensure that they were representative of the entire South Korean population, i.e., population weighting was applied during analysis. The SAS ver. 9.4 (SAS Institute Inc., Cary, NC, USA) PROC SURVEY procedure was used for stratification, and to create primary sampling units and construct population weights.
Air pollutant level and ENT disease prevalence data are presented as weighted mean (with 95% confidence intervals [CI]) and weighted prevalence (with 95% CI), respectively. Linear associations between air pollutant levels and ENT disease prevalence according to region were analyzed by Spearman’s correlation analysis. Air pollutants affecting the prevalence of ENT disease were subjected to multivariable logistic regression after adjusting for age, gender, and region. A two-tailed P-value <0.05 was considered to reflect significance. All analyses were performed using the SAS software.
RESULTS
Prevalence of ENT diseases
The prevalence of all studied ENT diseases is shown in Fig. 1. Of the five diseases evaluated, septal deviation was the most common in both males and females. With the exceptions of chronic rhinosinusitis and septal deviation, disease prevalence was similar between males and females; the former two diseases were much more common in males (chronic rhinosinusitis: odds ratio [OR], 7.55 vs. 4.70, P<0.001; septal deviation: OR, 54.19 vs. 34.88, P<0.001).

Prevalence of each ENT disease by gender in Korean adults.*P<0.05.
Association between air pollutant levels and ENT disease frequency
The concentrations of ambient air pollutants and prevalence of ENT diseases in 16 administrative regions of Korea are shown in Supplementary Table 1. The Spearman correlation coefficients between the level of each air pollutant and each ENT disease are listed in Table 1. Only the PM10 concentration and septal deviation correlated significantly (Spearman correlation coefficient, 0.507; P=0.045) (Fig. 2).

Correlation coefficients between air pollutant levels and ENT disease incidence

Correlation between particulate matter ≤10 μm in aerodynamic diameter (PM10) levels and the prevalence of septal deviation in 16 administrative regions of South Korea.
Adjusted ORs for the association between each disease and age, gender, and the levels of the five studied ambient air pollutants are listed in Table 2. Chronic otitis media was associated with older age (OR, 1.04; 95% CI, 1.03 to 1.05, P=0.000); allergic rhinitis was associated with younger age (OR, 0.98; 95% CI, 0.98 to 0.99; P=0.000). Chronic rhinosinusitis and septal deviation were more common in males, with ORs of 1.67 (95% CI, 1.34 to 2.09; P=0.000) and 2.29 (95% CI, 2.05 to 2.56; P= 0.000), respectively.
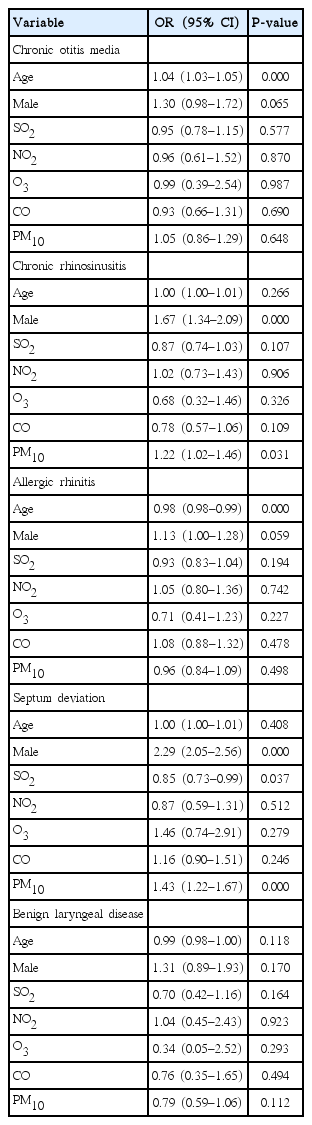
ORs for age, gender, and the levels of five air pollutants in terms of ENT disease risks, derived by multivariate logistic regression analysis
The strongest association was between septal deviation and PM10 levels. When the PM10 level increased by 1 μg/m3, septal deviation also increased significantly, with an OR of 1.43 (95% CI, 1.22 to 1.67; P=0.000). The next strongest association was that between chronic rhinosinusitis and the PM10 level. As the PM10 level increased by 1 μg/m3, chronic rhinosinusitis also increased significantly, with an OR of 1.22 (95% CI, 1.02 to 1.46; P=0.031). No other air pollutant was associated with an increased prevalence of an ENT disease.
DISCUSSION
We analyzed the prevalence of five ENT diseases in South Korea in 2009 and found that an association with ambient air pollution levels. Of the five ENT diseases and five pollutants included in our analysis, the PM10 level was most strongly associated with both chronic rhinosinusitis and/or septal deviation; an increase in the PM10 level by 1 μg/m3 was associated with a 1.22% and a 1.43% increased risk of chronic rhinosinusitis and septal deviation, respectively.
One study conducted in Beijing found that the levels of PM10, NO2, and SO2 were positively associated with the number of outpatient visits to otolaryngology departments during winter [6]. Although the study settings are different, and although we found no associations between NO2 and SO2 levels and disease, it is notable that PM10 levels were closely associated with ENT disease in two Asian studies.
PM is an air-suspended mixture of microscopic solid or liquid matter [7] and is subdivided into coarse PM (particles 2.5–10 μm in diameter), fine PM (particles 0.1–2.5 μm in diameter), and ultrafine PM (particles 0.1 μm in diameter). Of these, PM10 particles are derived from road dust, material sloughed off vehicle brakes and tires, and construction activities such as crushing. Awareness of the significance of PM has grown recently; a good deal of evidence shows that PM exerts potentially damaging effects. One study found that the PM10 concentration was significantly associated with the number of emergency department visits by asthmatic patients [8]. Other research showed that PM2.5 levels were clearly associated with the prevalence of out-of-hospital cardiac arrest [9]. Another study showed that total suspended particle levels influenced the prevalence of ischemic stroke [10]. The International Agency for Research on Cancer and the World Health Organization consider PM to be more hazardous than any other pollutant: PM has been designated a group 1 carcinogen [11].
Although the means by which PM10 particles induce chronic rhinosinusitis remains poorly understood, disruption of the sinonasal epithelial barrier may contribute to the development of the condition. Changes in tight junction protein levels were first recorded in subjects with nasal polyposis [12]. In the cited study, the expression levels of tight junction proteins decreased 72 hours after the nasal polyp epithelium was exposed to cytokines. A recent study found that PM particles disrupted the epithelial barrier by stimulating endocytosis and destroying cell junctions via oxidative stress and activation of a MyD88-dependent mechanism. Moreover, PM promoted the secretion of inflammatory cytokines, including interleukin-25 and interleukin-33, by the sinonasal epithelium [13].
Concerning allergic rhinitis, many previous studies have shown an association between this condition and air pollutant levels in children [14-16]. However, we found no such relationship; this may be because we excluded those under 19 years of age. The prevalence of allergic rhinitis falls with age, peaking at 37 per 1,000 subjects aged 10–15 years, and falling to 3 per 1,000 in those aged over 65 years [17].
Although septal deviation is a common diagnosis in otolaryngology clinics, there is no consensus for the objective diagnosis of septal deviation. For this reason, the data relating to septal deviation are without strong evidence. To overcome this problem, many previous studies have investigated the accuracy of various diagnostic modalities such as acoustic rhinometry [18], rhinomanometry [19] and nasal spectral sound analysis [20], computed tomography, and endoscopy [21]. In 2012, Sedaghat et al. [22] showed that clinical assessment including anterior rhinoscopy and nasal endoscopy before and after topical decongestion is highly accurate in forecasting which individuals would require septoplasty. In 2016, Andrades et al. [21] studied the diagnostic accuracy of various diagnostic tools in predicting nasal septum abnormalities. For localized septal deviation, computed tomography had the highest accuracy; for C-shaped and S-shaped septal deviation, nasal endoscopy showed the highest rates of achievement for sensitivity, specificity, positive prediction value, and negative prediction value. Computed tomography is independent of the operator. However, individuals are exposed to radiation, and there are high costs associated with this procedure. Meanwhile, endoscopy is dependent on the operator, with a diverse inter-observer range. However, if it is conducted by experienced experts it has high reliability as well as a low cost [21]. Moreover, considering that computed tomography is inapplicable for public health screening programs, such as that used in this study, nasal endoscopy is thought to be the most appropriate diagnostic tool.
This study showed that there is an association between PM10 levels and septal deviation. Studies in Mexico explored the change of nasal mucosa by taking biopsies from citizens in Mexico City and showed basal cell hyperplasia and squamous metaplasia in histopathology and a stack of p50 protein in immunohistochemistry. These changes might lead to nasal mucosa hypertrophy and neovascularization [7,23-25].
Our study had certain strengths. First, we used nationwide data from a representative sample of the general Korean population. Second, we found an association between air pollutant levels and the prevalence of ENT diseases; these may be accompanied by upper airway diseases. Studies on the relationships between air pollutant levels and upper airway disease frequencies are rare.
This study showed that the concentration of PM10 is positively associated with the risk of chronic rhinosinusitis and septal deviation in male. Many studies tried to show the role of gender in air pollution epidemiology. Among them, some studies reported the stronger effects on lower airway in male than in female [26-34]. Abbey et al. [26] showed the relationship of PM10 with the reduced lung function in males. For this result, the authors suggested gender differences in epidemiology derived from work-related exposures. They supported this by the cohort study, in which males spend more time outdoors and it might induces in males with genetic temperament to respiratory illness. Despite of this study for lung function, it might to be partially applicable to upper airway disease (chronic rhinosinusitis and septal deviation). However, it remains unclear whether the gender difference is a result of sex-linked biological responses (i.e., hormone, body size) or exposure patterns (i.e., activity, coexposures). Most modification seems to be made up of combination of these two factors. Excluding these factors is challenging necessary completely for identifying the relevant pathophysiology for differential air pollution influences on health [35,36].
Our study also had certain limitations. First, we integrated the individual data on air pollutant levels and upper airway disease and analyzed their relationship. Thus, we cannot identify the pathophysiolgies and etiologies of ENT diseases. Second, the criteria for septal deviation are subjective. Over the past few years, several criteria for septal deviation have been used. However, official criteria for septal deviation have yet to be determined. Further studies using objective criteria are needed in the future. Third, we were unable to conduct a multi-year study. Because ENT diseases have a chronic and complex pathophysiology, investigation into chronic exposure to pollutants over several years must be performed. Further studies in the future including multi-year data are needed. Fourth, we had no data on meteorological variables, including temperature, humidity, pressure, or wind speed. Finally, we could not perform time series analysis because the KNHANES has been conducted at various times throughout the year. In conclusion, of the five air pollutants and five ENT diseases included in our present analysis, the effects of PM10 levels on both chronic rhinosinusitis and septal deviation were significant in male.
HIGHLIGHTS
▪ The particulate matter ≤10 μm in aerodynamic diameter (PM10) concentrations showed positive association with the risk of chronic rhinosinusitis in male.
▪ Increased levels of PM10 were related with increased risk of septal deviation in male.
▪ This represents the PM10 concentration is associated with chronic rhinosinusitis and septal deviation and further study is needed to figure out the causal relationship.
Notes
No potential conflict of interest relevant to this article was reported.
Authors’ contributions
Conceptualization: MP, MKP. Data curation: MP. Formal analysis: JSL. Funding acquisition: MKP. Methodology: MP, MKP. Project administration: MKP. Visualization: & Writing - original draft: MP. Writing - review & editing: MKP.
Acknowledgements
This subject was supported by Korea Ministry of Environment (MOE) as “The Environmental Health Action Program”(20160-01360009), Sejong, Republic of Korea.
SUPPLEMENTARY MATERIALS
Supplementary materials can be found via https://doi.org/10.21053/ceo.2018.00612.