Cluster Analysis of Inhalant Allergens in South Korea: A Computational Model of Allergic Sensitization
Article information

Abstract
Objectives.
Sensitization to specific inhalant allergens is a major risk factor for the development of atopic diseases, which impose a major socioeconomic burden and significantly diminish quality of life. However, patterns of inhalant allergic sensitization have yet to be precisely described. Therefore, to enhance the understanding of aeroallergens, we performed a cluster analysis of inhalant allergic sensitization using a computational model.
Methods.
Skin prick data were collected from 7,504 individuals. A positive skin prick response was defined as an allergen-to-histamine wheal ratio ≥1. To identify the clustering of inhalant allergic sensitization, we performed computational analysis using the four-parameter unified-Richards model.
Results.
Hierarchical cluster analysis grouped inhalant allergens into three clusters based on the Davies-Bouldin index (0.528): cluster 1 (Dermatophagoides pteronyssinus and Dermatophagoides farinae), cluster 2 (mugwort, cockroach, oak, birch, cat, and dog), and cluster 3 (Alternaria tenus, ragweed, Candida albicans, Kentucky grass, and meadow grass). Computational modeling revealed that each allergen cluster had a different trajectory over the lifespan. Cluster 1 showed a high level (>50%) of sensitization at an early age (before 19 years), followed by a sharp decrease in sensitization. Cluster 2 showed a moderate level (10%–20%) of sensitization before 29 years of age, followed by a steady decrease in sensitization. However, cluster 3 revealed a low level (<10%) of sensitization at all ages.
Conclusion.
Computational modeling suggests that allergic sensitization consists of three clusters with distinct patterns at different ages. The results of this study will be helpful to allergists in managing patients with atopic diseases.
INTRODUCTION
Allergic sensitization is the outcome of a complex interplay between an allergen and a host in a given environmental context. This process can induce unfavorable allergen-related immune responses, resulting in atopic diseases such as allergic rhinitis (AR) and asthma. For this reason, the precise and accurate detection of allergens is important for treating (immunotherapy) and preventing (allergen avoidance) atopic diseases. Several studies have reported that inhalant allergen sensitization can be affected by various factors, including genetics, age, exposure time, concentration of allergens, and other unknown factors [1-7]. Additionally, recent global shifts in climate might significantly affect the incidence of atopic diseases. For example, warming temperatures and increasing carbon dioxide levels may increase the pollen load, prolong pollen seasons, and intensify the allergenicity of various pollen allergens [8-10]. Increasing levels of air pollutants, including nitrogen oxide, nitrogen dioxide, and fine particulate matter could also cause an increased risk of atopic diseases [11-14].
Several epidemiological studies on allergic sensitization have been conducted [15-18]. In a pan-European study, sensitization to house dust mite, cat, and dog allergens was found to be particularly high in Nordic countries, whereas high sensitization to hazel, alder, and birch allergens was observed in Nordic countries and Central/Western Europe [15]. In a German study, the authors determined that inhalant allergen sensitization could be classified into seven sensitization patterns using factor analysis [16]. An analysis of data from the National Health and Nutrition Examination Survey in the United States suggested that the overall prevalence of allergic sensitization did not vary across census regions and that allergen-specific immunoglobulin E (IgE) antibodies clustered into seven biologically relevant groups [17]. Furthermore, in a Russian study, age-related IgE elevation was observed for pollen, cat, dog, and house dust mite allergens [18]. However, the exact patterns of inhalant allergic sensitization have yet to be clarified. Additionally, no studies have yet investigated inhalant allergic sensitization using precise and reliable computational approaches.
Therefore, in the present study, we obtained a large-scale data set of results of skin prick tests (SPTs) conducted over 11 years and performed computational modeling to identify specific patterns in the clustering of allergic sensitization. Specifically, we used the four-parameter unified-Richards model [19,20], which is more frequently used in the literature than the traditional Gompertz model. Herein, we describe the behavior of various inhalant allergens, which will shed light on the mechanisms underlying atopic diseases.
MATERIALS AND METHODS
Study population
This study collected the results from 8,080 SPTs performed between January 2003 and December 2013. We reviewed their diagnostic codes and included cases displaying positive symptoms in the upper and lower airways, such as rhinitis, rhinosinusitis, and asthma. We excluded 117 cases of non-Koreans and 459 cases with non-airway diseases (Fig. 1). Results from the remaining 7,504 SPTs were used to investigate and characterize allergic sensitization. Our data contained 3,172 SPTs (42.3%) from otolaryngology and 4,332 SPTs (57.7%) from pulmonology (Table 1). The mean age of enrolled subjects was 39.6±19.1 years, and 3,564 of the SPTs were positive (47.5%). This study was approved by the Institutional Review Board of Hanyang University Hospital, Seoul, Korea (IRB No. HYI-12-012).
Flowchart of the enrolled study population.
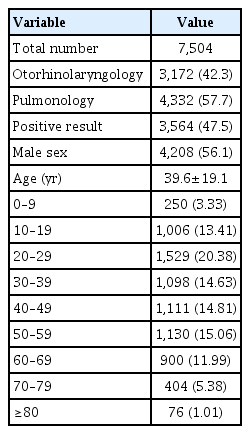
Demographic characteristics of the enrolled subjects
Evaluation of allergic sensitization
Each SPT was performed by a trained specialist according to the standard protocol [5,18]. We used a commercially available kit (Allergopharma, Reinbek, Germany) with thirteen inhaled allergens, a negative control (0.9% saline), and a positive control (1% histamine). The skin test results were interpreted after 15 minutes by measuring the mean size of the flares and wheals for each allergen. A positive reaction in the SPT was defined as an allergen to histamine wheal size ratio ≥1.
Statistical analysis
SAS/STAT ver. 9.4 (SAS Institute, Cary, NC, USA) was used to fit the allergen sensitization curves using the unified-Richards model. In the analysis of computational model, we used 13 frequent and representative inhalant allergens to obtain a clear result. The hierarchical clustering with Euclidean distance and Ward’s method selected for clustering, and the dendrogram visualization were implemented in SAS using cluster procedure. The formed clusters were evaluated by clustering validity indexes (Davies-Bouldin index [DBI]). For all allergen sensitization curves according to cluster groups, we compared the mean fitted parameter and the derived measurement values of the unified-Richards model using the Kruskal-Wallis test. Statistical analyses were carried out using STATA ver. 14.0 (StataCorp., College Station, TX, USA). All tests were performed two-sided, with P-value <0.05 considered significant.
Feature extraction by unified-Richards model
To estimate allergic sensitization curves, we plotted allergic sensitization at a certain age against age by smooth-curve growth model, using the four-parameter unified-Richards model [19]. This model is more frequently used compared to the traditional Gompertz model, and it is also more flexible than a three-parameter model, due to the extra d-parameter, which determines the exponent and controls the trait value at which the inflection occurs [19]. After pre-processing (i.e., the cumulative rate P(t) accumulates all of the rates p(t) less than or equal to t), from each rate of allergen sensitization, the a, b, c, and d features from the unified-Richards model are extracted as follows:
where t is time (age, year), p(t) is related to allergic sensitization at a certain age(t) by p(t)=P(t)–P(t–1), a is upper asymptote; trait value at which the curve converges (%), b is the slope at inflection; maximum relative growth rate at inflection (%/year), c is the time at inflection; age at maximum growth at inflection (year), exponent (d) is the affects trait value at maximum growth (at inflection), P0 is the value (initial point/intersection) on the y-axis (i.e., P(t) at t=0), v (
RESULTS
Trends and clustering of inhalant allergic sensitization over 11 years
In this study, we found that approximately half (47.5%) of our subjects had positive sensitization to at least one inhalant allergen. The positive results for each allergen were as follows: Dermatophagoides farinae (Df; 67.5%), Dermatophagoides pteronyssinus (Dp; 66.1%), cat (20.6%), mugwort (15.9%), dog (15.2%), cockroach (German, 14.4%), oak (13.1%), birch (12.4%), ragweed (7.9%), Candida albicans (7.2%), Kentucky grass (5.3%), meadow grass (5.3%), and Alternaria tenus (4.9%), During the past 11 years, the rate of allergen sensitization steadily increased, but the annual trend was not significant (P for trend=0.164) (Fig. 2). The dendrogram obtained by Ward’s method of hierarchical cluster analysis for 13 samples (allergens) and seven variables (rate of allergen sensitization, p(t); features, a, b, c, d, v, and w) primarily showed two clusters: house dust mites (Dp and Df, cluster 1) and other allergens (Fig. 3). The other allergens could be further divided into two clusters (DBI, 0.690): cluster 2 (mugwort, cockroach, oak, birch, cat, and dog) and cluster 3 (A. tenus, ragweed, Candida, Kentucky grass, and meadow grass). Thus, we found that inhalant allergens consisted of three clusters (DBI, 0.528).
Annual trends in allergic sensitization from 2003 to 2013 (P for trend=0.164).

Hierarchical cluster dendrogram of allergens. Height is a representation of similarity: the lower the number at the point of convergence, the more similar the clusters. Based on the Davis-Bouldin index (0.528), allergens were divided into three clusters (cluster 1: Dp and Df; cluster 2: A. tenus, ragweed, Candida, Kentucky grass and meadow grass; cluster 3: mugwort, cockroach, oak, birch, cat, and dog) under the red dotted line. Dp, Dermatophagoides pteronyssinus; Df, Dermatophagoides farinae; A. tenus, Alternaria tenus; Cokg, cockroach.
Computational (unified-Richards) model of allergic sensitization
We estimated the sensitization trends of the 13 allergens by age using the unified-Richards model according to cluster groups (Fig. 4). The first cluster (cluster 1) included house dust mites (Dp and Df) and showed a high level (>50%) of allergic sensitization at an early age (before 19 years) and the highest average estimates (a, 249.70%; P0, 22.92%; v, 75.83%; all P<0.05); however, it showed a lower average value of c (9.54 years) than cluster 2 or cluster 3 (18.00 and 12.42 years, respectively; P<0.05) (Table 2, Fig. 4A).

Rate of inhalant allergen sensitization for each of the three clusters by hierarchical clustering. (A) High-level allergic sensitization at an early age. (B) Moderate-level allergic sensitization at an early age. (C) Low-level allergic sensitization at all ages. (D) The average rate of allergic sensitization of each cluster. Dp, Dermatophagoides pteronyssinus; Df, Dermatophagoides farinae; Cokg, cockroach; A. tenus, Alternaria tenus.
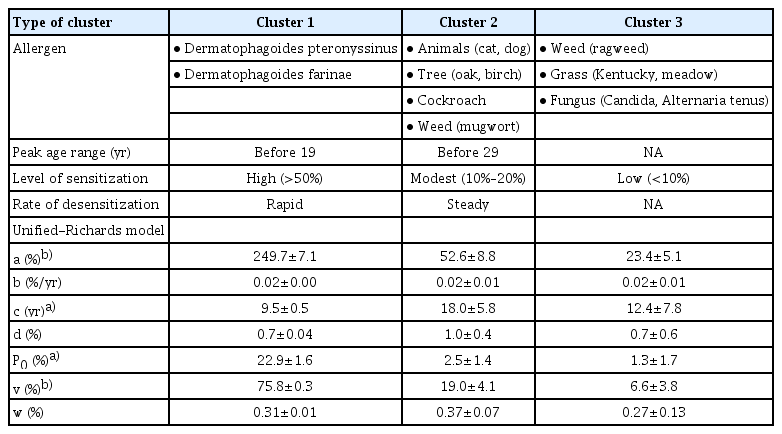
Clinical characteristics and computational model of allergen clusters
The second cluster (cluster 2) was ranked next, with a moderate level (10%–20%) of allergic sensitization before 29 years of age, but lower average estimates (a, 52.62%; P0, 2.47%; v, 19.01%) than cluster 1 (Table 2, Fig. 4B). The third cluster (cluster 3) was ranked last, with a low level (<10%) of allergic sensitization at all ages (Table 2, Fig. 4C). The average rate of allergic sensitization for all three clusters is presented in Fig. 4D.
In summary the average values for each estimate (a, P0, v) decreased by cluster ranking (cluster 1>cluster 2>cluster 3), whereas a trend of cluster 1<cluster 3<cluster 2 was observed for the c interaction. According to the estimated allergic sensitization curves of the three clusters, cluster 1 showed higher prevalence of allergic sensitization (56.08%) at the youngest age (16.1 years). The b and d values were similar for all three clusters, whereas for w, the trend was cluster 3<cluster 1<cluster 2. However, in these three cases, no statistically significant difference in the patterns of allergen sensitization was obtained using the unified-Richards model (Table 2).
Resolution patterns of three allergen clusters
The speed of resolution after allergic sensitization was different among the three clusters. Cluster 1 reached the highest prevalence level of allergic sensitization at an early age, followed by a rapidly decreasing prevalence (Fig. 4). Cluster 2 showed a moderate level of allergic sensitization before 29 years of age, followed by a steadily decreasing prevalence. However, cluster 3 showed no specific peak level of allergic sensitization.
DISCUSSION
Exposure to allergens is crucially important in the induction of sensitization and the development of atopic diseases, which often influence quality of life in terms of sleep, school, work, and social life [21-23]. Several studies have reported that the global prevalence of atopic diseases has risen significantly over the last 2 decades [24-30]. Moreover, a recent study form South Korea stated that the outpatient prevalence of AR increased approximately 2.3-fold, from 1.27% in 2003 to 2.97% in 2013, while that of asthma increased approximately 1.2-fold, from 6.08% in 2003 to 7.35% in 2011 [31]. However, most previous epidemiological studies have been based on surveys of allergic symptoms. Furthermore, only a few studies have conducted cluster analyses of inhalant allergen sensitization [16,17]. Therefore, studies providing a detailed characterization of inhalant allergen sensitization are still needed.
For these reasons, we reviewed data from SPTs obtained over the course of 11 years from patients with chronic respiratory diseases such as rhinitis, rhinosinusitis, and asthma. The inhalant allergens that were included in the present study are the most common 13 allergens responsible for AR in South Korea. Additionally, we investigated the characteristics of inhalant allergic sensitization using a computational approach. In the present study, we used the four-parameter unified-Richards model to estimate allergic sensitization curves using allergic sensitization plotted versus age using smooth-curve growth models, because this method is more frequently used than fitting traditional Gompertz models. Generally, inhalant allergic sensitization is modulated by several complex individual-level factors, which are intricately intertwined. In addition, the rate and pattern of sensitization differ by age for each allergen. In this study, we found that most inhalant allergens induced sensitization at 10–30 years of age and that sensitization showed a decreasing tendency with age. Thus, to estimate curves representing age-related inhalant allergic sensitization, we used the four-parameter unified-Richards model because various parameters should be included in the clustering analysis. Specifically, hierarchical clustering is a distance-based clustering algorithm that calculates the distance between allergies through the parameters of the unified-Richards model, and forms clusters among the allergies with the closest distance. Therefore, clustering results can be used as basic data to cope with and treat allergic sensitization in each age group by identifying allergies with similar patterns and determining the characteristics of each cluster of allergens. In this study, two weed allergens showed a markedly different prevalence (mugwort, 15.94%; ragweed, 7.91%). Thus, our computational model recognized mugwort and ragweed as different allergens.
Consistent with a previous study conducted in the USA [17], we found that 47.5% of subjects were positively sensitized to at least one inhalant allergen, and no change was observed in the overall sensitization rate (P=0.164) over the 11-year course of the study. Therefore, this symptom-based epidemiologic study may have overestimated the real prevalence of allergic diseases, which indicates the need for further in-depth research. In addition, we identified three clusters of inhalant allergic sensitization using the Ward method of hierarchical clustering. Initially, on the dendrogram, we observed two representative groups with an optimal number, including Dp/Df and other inhalant allergens (DBI, 0.116). Thus, we performed further cluster analysis of the group, excluding Dp/Df based on its DBI of 0.690 and finally obtaining three clusters with a DBI of 0.528.
A novel contribution of the present study is that we investigated patterns of sensitization to inhalant allergens using the unified-Richards model according to clusters. To our knowledge, this is the first study to estimate age-specific allergic sensitization curves and to find three allergen clusters with distinct patterns and trajectories over the lifespan. Cluster 1 and cluster 2 showed distinct peak age groups, with different rates of decreasing sensitization, whereas there was no specific peak age range in cluster 3. Specifically, house dust mites (cluster 1) were the most common inhalant allergen (more than 50% among positive allergen results) in this study. Previously, Kim et al. [32] reported that South Korean school children showed a 47.9% rate of allergic sensitization to SPTs, with house dust mites found to be the most common allergens. Another multicenter study from South Korea also stated that the overall prevalence of allergic sensitization was 45.3% and that house dust mites were the most commonly sensitized allergens [2]. Additionally, house dust mites showed a high level (>50%) of allergic sensitization before adulthood. These findings could explain the higher prevalence of AR in children and adolescents, as it is well-known that AR symptoms develop in about 20% of children by 2 to 3 years of age and in about 40% by the age of 6 years [33-35]. Meanwhile, our findings showed that almost all allergens showed a decreased positive sensitization rate as a function of age in adulthood. Interestingly, the decreasing rate of sensitization was rapid in cluster 1, whereas cluster 2 had a steadily decreasing rate of sensitization. Consistent with our findings, another population-based study described that the prevalence of AR decreased from 20–44 years to 65–84 years, without a significant difference by sex [36]. These consistent findings of an age-related decrease in sensitization support the immunosenescence hypothesis [37,38], which posits that the immune response shows a gradual deterioration with age. In terms of prevalence and peak ages, cluster 1 and cluster 2 may be the most important inhalant allergens in South Korea. Thus, it can be hypothesized that early control of allergic sensitization to cluster 1 and cluster 2 can be of great help in treating allergic diseases. Therefore, further study is needed to verify the clinical relevance of our findings and hypothesis.
We acknowledge that our study has some limitations. First, this study obtained information on inhalant allergic sensitization from patients who had been referred to a tertiary hospital; therefore, our results may not exactly reflect geometric differences in allergic sensitization in the general population [2]. Second, this study investigated the results of SPTs performed in patients with chronic respiratory diseases, but it was not possible to analyze symptom patterns according to allergen clusters.
In conclusion, we found that inhalant allergens in South Korea consisted of three hierarchical clusters. Additionally, unified-Richards modeling showed that these three clusters had distinct sensitization-desensitization patterns according to age. Therefore, these novel findings could help us understand the characteristics and behavior of inhalant allergens, which may influence the diagnosis and treatment algorithms used for allergic diseases.
HIGHLIGHTS
▪ To understand the patterns and clustering of inhalant allergic sensitization, we performed computational analysis using the four-parameter unified-Richards model.
▪ We identified three hierarchical clusters of inhalant allergen sensitization (cluster 1, Dermatophagoides pteronyssinus and Dermatophagoides farinae; cluster 2, Alternaria tenus, ragweed, Candida, Kentucky and meadow grass; cluster 3, mugwort, cockroach, oak, birch, cat and dog).
▪ Computational modeling showed a different growth pattern according to each cluster (cluster 1, a high-level of sensitization at an early age followed by rapid desensitization; cluster 2, a moderate-level of sensitization before 29 years of age followed by a steady desensitization; cluster 3, a low-level of sensitization at all ages).
Acknowledgements
This research was supported by the research fund of Hanyang University (HY-2015), a grant (2017R1D1A1B03028797) from the National Research Foundation of Korea funded by the Korea Ministry of Science, ICT, & Future Planning (MSIP), and by the Korea Ministry of Environment (MOE) through the Environmental Health Action Program (2016001360003). This research was also supported by Basic Science Research Program through the National Research Foundation of Korea (NRF) funded by the Ministry of Education (2020R1A6A1A06046728).
Notes
No potential conflict of interest relevant to this article was reported.
AUTHOR CONTRIBUTIONS
Conceptualization: HJY, SHC. Data curation: KRK, SHK, HJY, SHC. Formal analysis: YSP, KJC, DJ, SR. Funding acquisition: DKK, KJC, SHK, SHC. Methodology: YSP, KJC, DJ, SR. Project administration: SHC. Visualization: YSP, SR. Writing–original draft: DKK, YSP. Writing–review & editing: HJY, SHC.