


INTRODUCTION
An interesting issue in aesthetics involves the changes that occur in the face as a result of aging. Among these various facial changes, those to the nose are likely the most significant, often leading to a desire for rhinoplasty. Based on patient surveys conducted from 2005 to 2014 [1], rhinoplasty represents approximately 10% of all cosmetic procedures performed annually on patients aged 55 and older. Furthermore, previous studies have indicated that older adults express satisfaction following rhinoplasty, not only due to improvements in structural functionality [2,3], but also in terms of both aesthetic and psychological aspects [4].
Changes in nasal appearance are a topic of interest in various academic fields, and numerous studies have been conducted on related diagnostic and clinical procedures. Based on the established knowledge of substantial variations in facial anthropometric measurements with sex and age [5], earlier research has presented quantitative findings regarding age-related changes in the nasal structure and dimensions across diverse ethnic populations, including North Americans [6], Europeans [7], French Canadians [8], Chinese [9], and Japanese [10]. Various methods have been used to measure nasal and facial structure, with the most commonly used tools including direct anthropometric measurements [11], three-dimensional (3D) laser scanners [12], 3D photogrammetry [13], and computed tomography (CT) [14,15]. In these studies, notable aging-related changes have been identified not only in soft tissue areas, such as the nasal tip, nasolabial region, dorsum, and nasal length, but also in bony parameters, including the glabella angle, orbital angle, pyriform aperture, and maxillary angle [16,17].
However, no previous studies have examined changes in the nasal area over time within the same individuals. Even with the same race and age, individuals have their own unique musculoskeletal variations. In this manner, comparing aging-related changes in the same individual would eliminate errors arising from factors such as race, sex, and musculoskeletal characteristics, resulting in more reliable measurement values. Therefore, this study aimed to analyze aging-related changes in nasal morphometry within an individual over at least 10 years by pairing previous and recent 3D reconstructed CT images, and to assess whether the degree of change varied across different age groups.
MATERIALS AND METHODS
We retrospectively reviewed patients who underwent at least two CT scans of the nasal region with an interval of at least 10 years between scans at Samsung Medical Center (Seoul, Korea) between January 2006 and December 2021. A total of 48 adult Korean patients were enrolled in this study. The exclusion criteria were as follows. First, patients with probable nose change due to chronic rhinosinusitis surgery, septoplasty, rhinoplasty, turbinoplasty, tumor surgery, tumors that did not undergo surgery, or reduction history by trauma were excluded. Second, various conditions that might induce bone changes, such as acromegaly, Paget’s disease, osteogenesis imperfecta, and Cushing’s syndrome, were also excluded. Third, patients with a body mass index (BMI) that changed more than 5 kg/m2 with time were excluded due to the possible change in facial fat volume.
The study was reviewed and approved by the Institutional Review Board at Samsung Medical Center (No. 2022-12-123-001), and informed consent requirement was waived.
Device and software
The CT imaging was conducted using Toshiba Aquilion systems (Toshiba Medical Systems). The axial images had a width range between 2.0 mm and 0.6 mm, as advancements in CT technology allowed for thinner cuts over time. Using picture archiving communication system (PACS) functions in Infinitt PACS (Infinitt Healthcare), coronal and sagittal images were reconstructed along with axial cuts, and the whole images were precisely controlled by scan orientation along the X, Y, and Z axes. For three-planar reconstruction, axial DICOM (Digital Imaging and Communications in Medicine) image files extracted from the CT scan were applied to the image-analysis software AMIRA 5.4 (Mercury Computer Systems/3D Viz group).
Measurement of 3D nasal morphometry
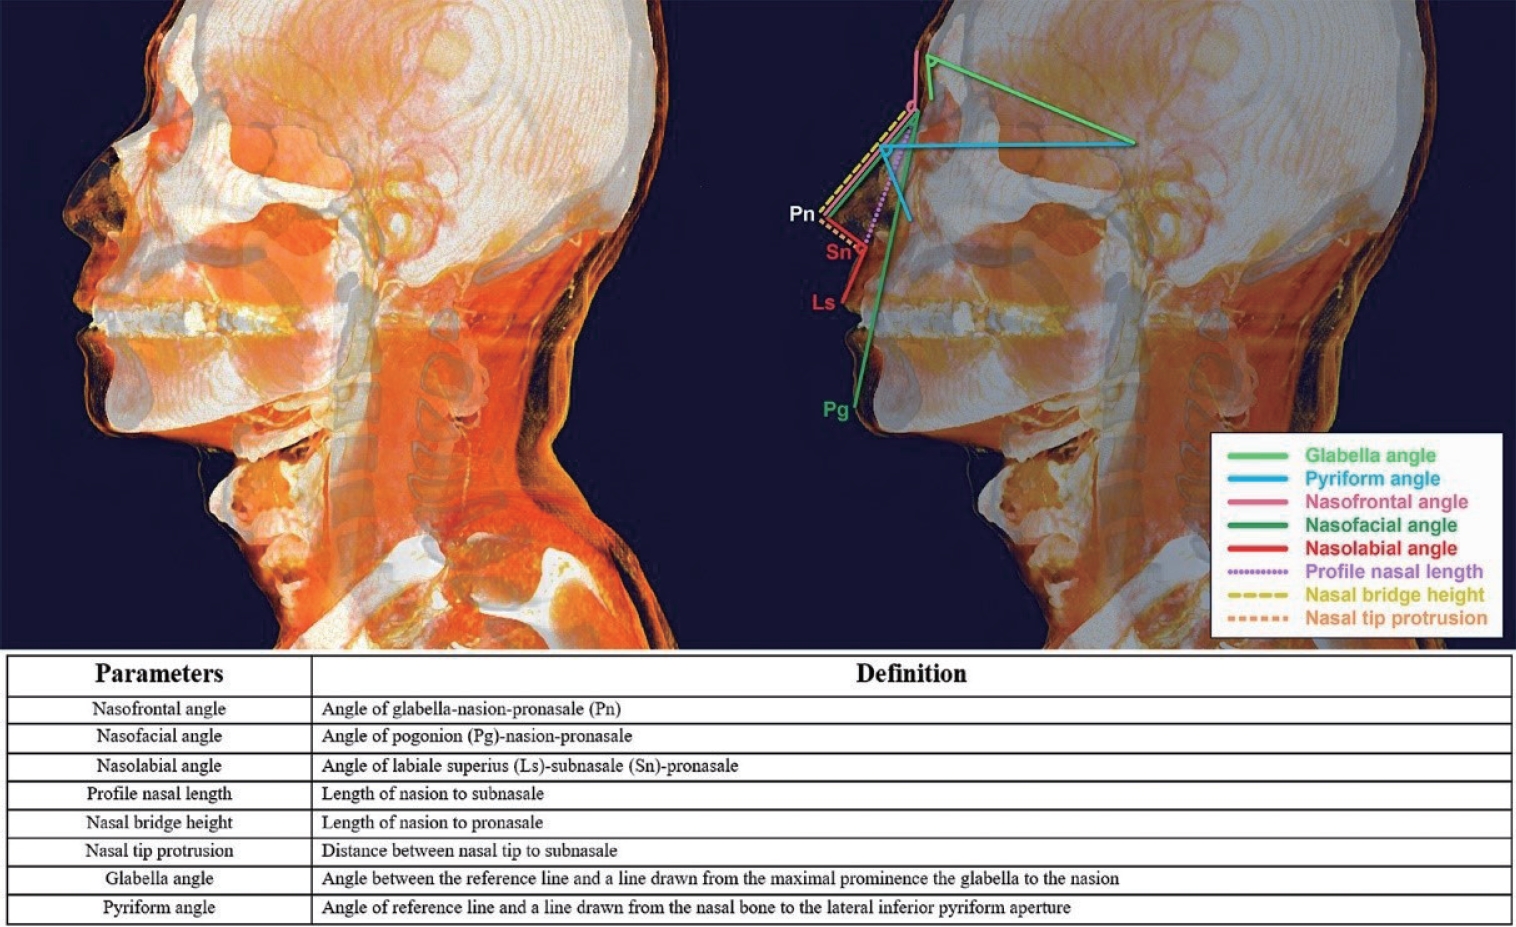
By adjusting the resolution using the AMIRA program, the location of the sella inside the cortical bone was checked. The scans were standardized by obtaining a midsagittal view and drawing a reference line from the sella through the nasion to serve as the reference for the Z-axis. All parameters were marked with dashed and solid lines in different colors, and their definitions were listed (Fig. 1). Based on that, the nasofrontal angle, nasofacial angle, nasolabial angle, profile nasal length, nasal bridge height, nasal tip protrusion, glabella angle, and pyriform angle were measured.
Statistical analysis
Statistical analysis was performed by SAS version 9.4 (SAS Institute), and a P-value <0.05 was considered statistically significant. The Kruskal-Wallis test was used to compare the difference in BMI among the age and sex-based six subgroups at the time of initial imaging, and the paired t-test or Wilcoxon signed-rank test according to normality assumption was used to determine the significance of the change between initial and latest CT scans of the same individual. One-way analysis of variance was used to identify any differences among the age groups, and multivariable linear regression analysis was adjusted for potential confounders, sex, BMI, and age intervals in the age group comparisons.
RESULTS
All 48 patients had both initial and latest CT scans available, resulting in a total of 96 CT scans. These scans were analyzed using 3D reconstruction for nasal morphometry.
Demographics
The study population was divided by age at the time of the initial CT scan. Seventeen patients (5 men, 12 women) were in the young age group (20–39 years), 20 patients (4 men, 16 women) were in the middle age group (40–49 years), and 11 patients (6 men, 5 women) were in the old age group (≥50 years). Since this study required a follow-up period of at least 10 years, the old age group, based on the initial imaging, was defined as 50 years or older. Upon re-evaluating the ages based on the time of the most recent imaging, it was found that all patients in this group were now over 60 years old. In a comparison of the mean BMI among the six subgroups based on age and sex at the time of the initial imaging, no significant differences were observed in either the initial (P=0.149) or the latest (P=0.310) scans (Table 1).
Paired comparisons between the initial and latest images
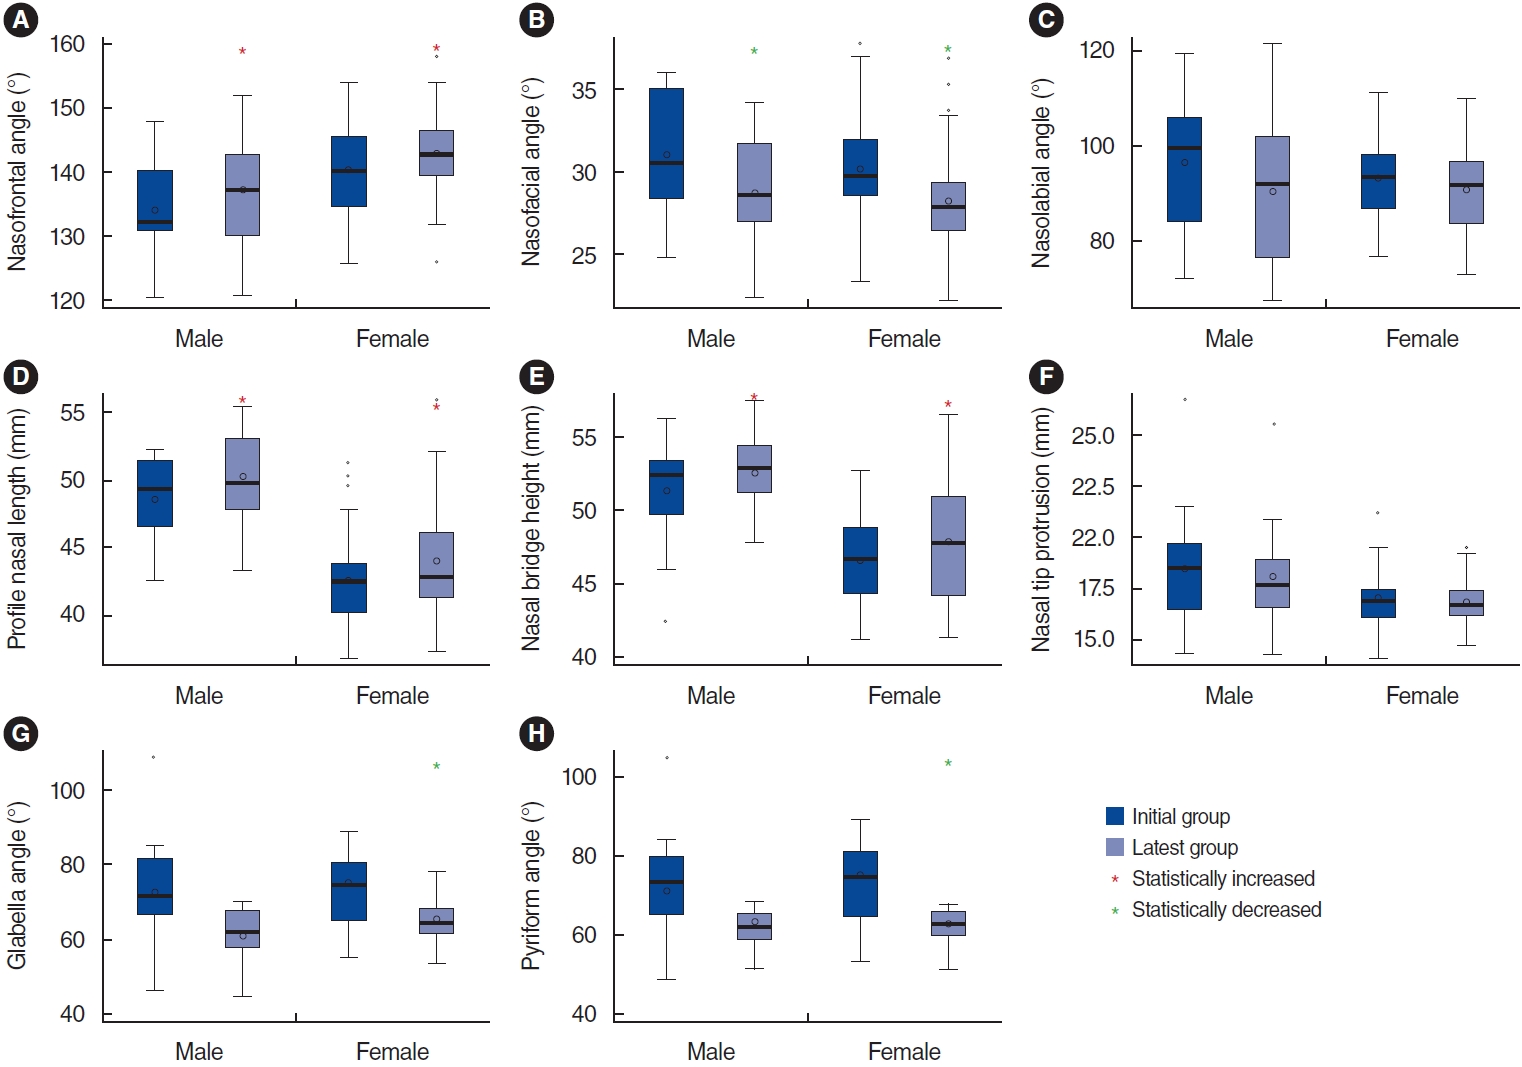
After measuring eight nasal morphometric parameters from the initial and recent images of all participating patients, a paired comparison was conducted between the two images from each individual. The results are summarized in Table 2. For a clearer illustration of trends, the parameters of each subgroup are displayed as box plots (Fig. 2).
Over an average image interval of 12 years, men exhibited increases in the nasofrontal angle (3.2°±5.4°, P=0.041), profile nasal length (1.7±1.7 mm, P=0.002), and nasal bridge height (1.2±1.6 mm, P=0.002). Conversely, there was a decrease in the nasofacial angle (–2.3°±2.9°, P=0.010). In women, there were statistically significant increases in the nasofrontal angle (2.5°±5.2°, P=0.010), profile nasal length (1.4±1.9 mm, P<0.001), and nasal bridge height (1.3±1.6 mm, P<0.001). However, there were decreases in the nasofacial angle (–2.0°±2.1°, P<0.001), glabella angle (–9.1°±9.8°, P<0.001), and pyriform angle (–8.5°±10.1°, P<0.001).
Comparison of the degree of nasal morphologic changes by specific age group
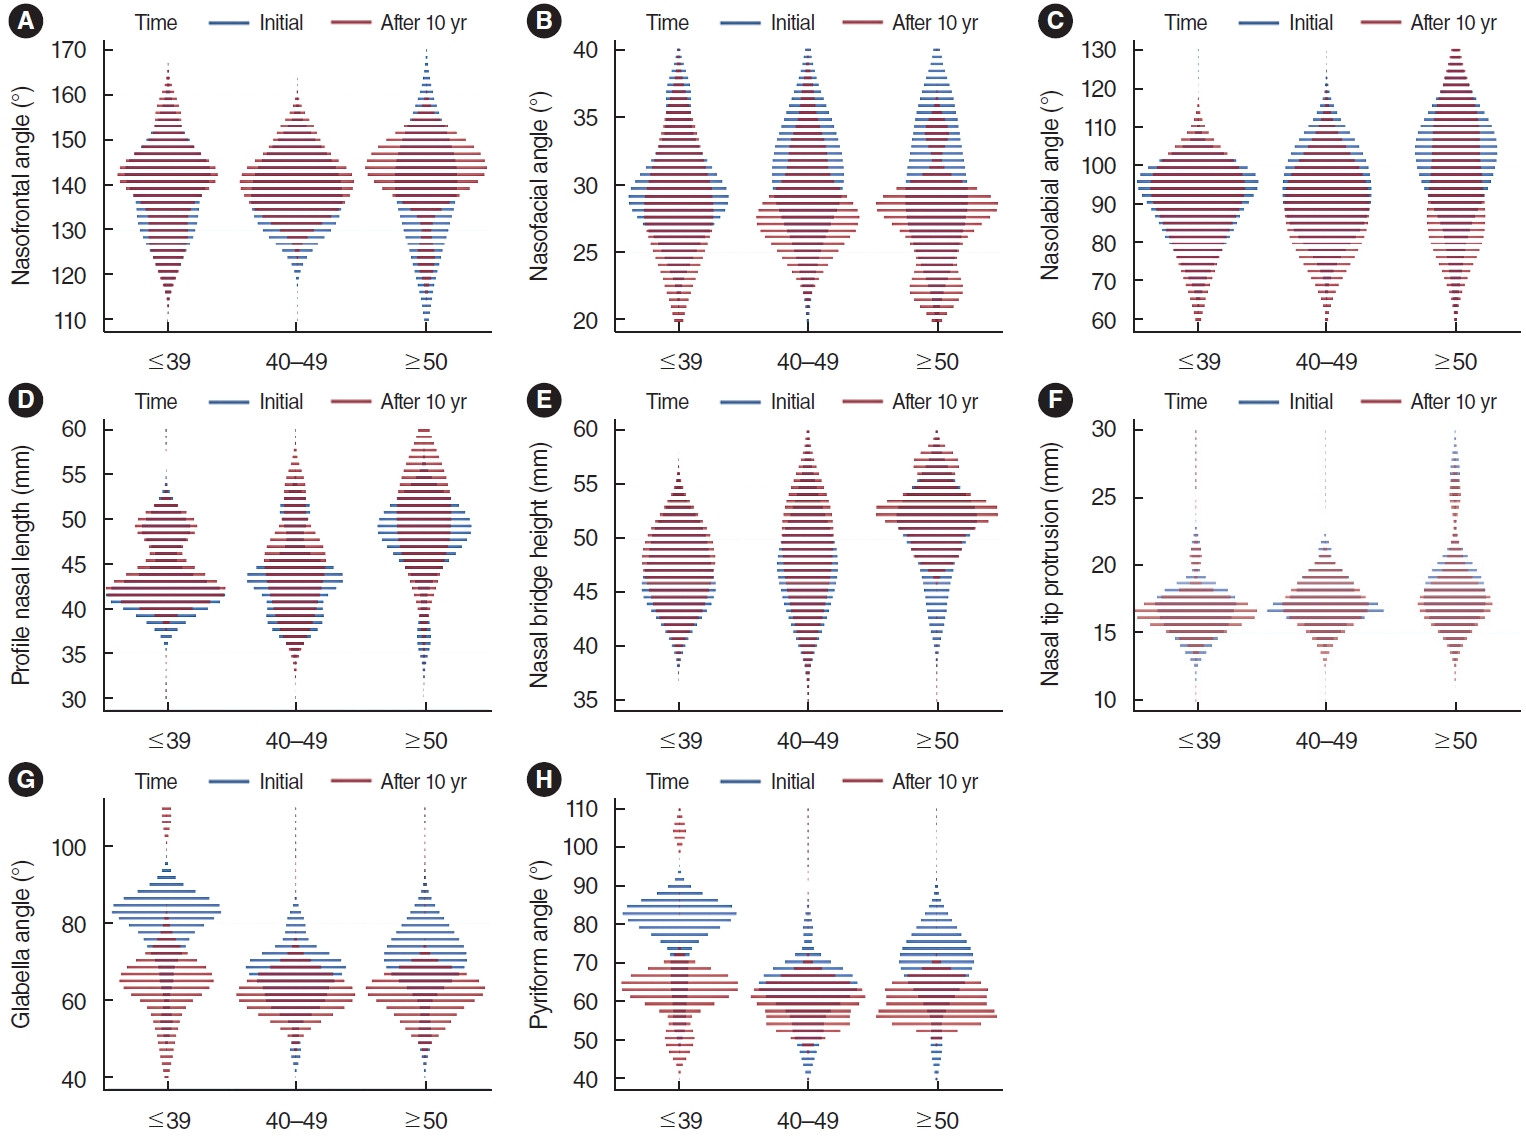
To evaluate whether the rate of aging in the measurement area varies across different age groups, we compared the degree of parameter changes using both univariate and multivariate analyses. These analyses were adjusted for sex, BMI, and age interval within three age-based subgroups. The results of these comparisons are summarized in Table 3. To more effectively illustrate trends, the parameters of changes between the initial and most recent images are displayed as violin plots (Fig. 3).
As shown in Table 3, there were no statistically significant changes in the nasofrontal angle, nasofacial angle, nasolabial angle, profile nasal length, nasal tip protrusion, and glabella angle among the three subgroups, according to both univariate and multivariate analyses. However, the nasal bridge height did show a significant difference. The mean difference was 0.7±0.9 mm in the young group, 1.4±1.4 mm in the middle-aged group, and 2.2±2.3 mm in the older group. This demonstrates a statistically significant progressive increase in the degree of change among the three groups, as shown by both univariate (P=0.049) and multivariate (P=0.036) analyses. As for the pyriform angle, the mean difference was –14.5°±14.3° in the young group, –3.0°±7.4° in the middle-aged group, and –8.6°±11.0° in the older group. Significant differences were observed among the three groups in both univariable (P=0.011) and multivariable (P=0.022) analyses.
DISCUSSION
Changes in nasal anatomy related to aging are significant. Even minor deviations in the structure of the nose can result in noticeable and undesirable alterations, potentially leading to a desire for procedures such as rhinoplasty [18]. In our study, paired matching between the initial and most recent images revealed an increase in the nasofrontal angle, profile nasal length, and nasal bridge height. Simultaneously, there was a decrease in the nasofacial angle with aging in both sexes. These changes result in aged noses displaying a relatively longer nasal length and a downward angulation of the nasal tip. Aging may lead to potential ossification of the cartilages and loosening of suspensory ligaments, which could cause migration in the direction of gravity [19]. This hypothesis is consistent with our study’s findings. The only parameter that did not show a difference was the nasal tip protrusion. This might suggest that the distance between the subnasale and pronasale remains unchanged despite the drooping of the tip.
Previous studies using different tools to measure nasal parameters reported similar results to our research. Kwon et al. [13] measured 41 age-related facial soft tissue changes in Korean women using 3D photogrammetry, reporting a greater nasofrontal angle and smaller nasofacial angle in older women than in younger women. Another study by Lee et al. [20] measured 15 age-related facial metrics in a large Korean population using the photogrammetric method and found that the nasal tip protrusion slightly decreased with age in both sexes, while the profile nasal length slightly increased with age only in men. However, all these previous studies with external measurements did not evaluate bony changes, as they could not assess inner structures, which limited the clinical significance of understanding the actual nasal aging process according to age.
Our study measured bony structures after obtaining reference lines using 3D reconstruction methods. The results indicated a decrease in the angle of the glabella and pyriform in aging women. A similar decreasing trend was observed in men, but the statistical differences were not significant, likely due to the small patient sample size. These changes align with Lambros’s theory, which attributes alterations in the aging facial skeleton to the shifting of the maxilla and the orbital rim. This shift results in a clockwise rotation of the bones [21]. Previous studies involving various ethnicities have reported similar findings, with the facial bone rotating in both men and women. This rotation causes the glabella angle to regress and induces positional changes in the soft tissue as aging progresses [16,17].
We also aimed to determine if the extent of nasal morphological changes varied based on specific age groups. When comparing the three subgroups by initial age, most parameters did not show any statistically significant differences in the extent of changes. However, the height of the nasal bridge did exhibit an increasing degree of change with age. The pyriform angle also differed among the three subgroups. The youngest group displayed the greatest degree of change, but it also included some outliers with large standard deviations. This suggests that caution is needed when interpreting these results.
Performing rhinoplasty requires careful consideration both before and after the procedure. Even if the surgical correction is performed well and yields aesthetically pleasing results, changes in the external appearance of the nose may still occur over time. This is particularly true when materials like silicone and expanded polytetrafluoroethylene are used during the procedure. The overall shape of the nose may deform over time due to the incongruity between these inserted materials, which do not age, and the natural aging process of the nose. Therefore, based on these findings, it is recommended that more accurate counseling be provided prior to rhinoplasty, taking into account the potential age-specific changes in nasal angles and shapes.
To the best of our knowledge, this study is the first to assess changes in nasal morphometry due to aging within the same individual. While previous studies have discussed anatomical changes associated with aging, none have analyzed these changes within the same individual, leading to limitations in controlling for musculoskeletal variations. A paired matching evaluation could mitigate bias by eliminating potential variations, and this method could be effectively applied even with a small number of participants.
There were several limitations in our study. First, CT scans can have errors due to biological functions of the patient such as breathing, emotional state, and facial expressions. These factors can particularly affect the accuracy of measurements related to the nasal angle and shape. For instance, the nasolabial angle measurement might vary depending on the degree of lip protrusion at the time of image acquisition. Second, while we excluded major factors such as surgery, trauma, and changes in BMI from this study, there are other factors that influence aging, such as tobacco use, alcohol consumption, exposure to sunlight, and eating habits. These should be considered as potential confounding factors. To minimize these variations and errors, a well-designed, controlled, prospective study with a larger study population is recommended.
In conclusion, our study results suggest that the aging nose tends to have a relatively longer nasal length and a downward angulation of the nasal tip. This is accompanied by an increase in the nasofrontal angle, profile nasal length, and nasal bridge height, as well as a decrease in the nasofacial angle. Aging impacts not only the soft tissue and cartilage but also the mid-face bony structures. While most of the degree of nasal morphological changes showed no significant differences across specific age groups, some values may vary by age group.
HIGHLIGHTS
▪ This study analyzed the differences in nasal morphometry with age and the degree of changes in individuals over at least 10 years by pairing previous and recent three-dimensional reconstructed computed tomography images.
▪ The aging nose exhibited relatively greater nasal length with inferior angulation of the nasal tip; an increase in the nasofrontal angle, profile nasal length, and nasal bridge height; and a decrease in the nasofacial angle.
▪ Most nasal morphologic changes demonstrated no significant differences by specific age group, although some values may vary.
▪ This study is the first to evaluate aging-related changes in nasal morphometry within the same people, controlling for personal musculoskeletal variations.
▪ More accurate counseling considering age-specific changes in nasal angles and shapes should be performed before rhinoplasty.