Predictors of Early and Late Response to Esomezol and Lifestyle Modification in Adults With Laryngopharyngeal Reflux Disease: A Prospective, Multicenter, Open-Label Cohort Study
Article information

Abstract
Objectives
This study aimed to assess predictors of the response to varying durations of proton pump inhibitor (PPI) use and lifestyle modification treatment for laryngopharyngeal reflux disease (LPRD).
Methods
Between October 2014 and June 2016, a prospective, multicenter, open-label, single-cohort, intention-to-treat, observational study was conducted at eight referral hospitals across the Republic of Korea to examine predictors of early and late response to treatment in adult patients (age ≥19 years) with LPRD. Participants underwent standard treatment (PPI [Esomezol] and lifestyle modification) for 3 months. Response to treatment was defined as greater than 50% improvement in reflux symptom index score. The primary outcome was potential predictors of treatment response at 1 and 3 months. The secondary outcome was potential predictors distinguishing early from late responders.
Results
In total, 394 patients were enrolled. Improved sleep habits was a positive predictor (odds ratio [OR], 1.785; 95% confidence interval [CI], 1.06–3.007; P=0.029), while initial alcohol consumption (OR, 0.587; 95% CI, 0.355–0.969; P=0.037) and past medication history (OR, 0.438; 95% CI, 0.215–0.891; P=0.005) were negative predictors of response after 1 month of treatment. High pre-reflux finding score was a positive predictor (OR, 1.187; 95% CI, 1.049– 1.344; P=0.007), while male sex (OR, 0.516; 95% CI, 0.269–0.987; P=0.046), higher depression score (OR, 0.867; 95% CI, 0.784–0.958; P=0.005), and past thyroid hormone medication history (OR, 0.161; 95% CI, 0.033–0.788; P=0.024) were negative predictors of response after 3 months of treatment. Past medication history (OR, 0.438; 95% CI, 0.215–0.891; P=0.023) was the only negative predictor for early responders compared to late responders.
Conclusion
Adult patients with LPRD and a history of prior medication use may require longer treatment durations to achieve a therapeutic response. Future research should explore the incorporation of diverse treatment approaches to improve treatment outcomes for patients exhibiting negative prognostic indicators.
INTRODUCTION
Laryngopharyngeal reflux disease (LPRD) is differentiated from gastroesophageal reflux disease (GERD) as a condition affecting the larynx and pharynx due to gastric or duodenal content reflux [1]. LPRD is a relatively common disease, with an estimated prevalence of up to 4% to 30% among outpatients visiting otorhinolaryngology clinics [2-6]. Recommendations indicate that for patients suspected of having LPRD, the reflux symptom index (RSI) and reflux finding score (RFS) should be assessed through a combination of medical history-taking and a laryngoscopic examination.
Empirical proton pump inhibitor (PPI) therapy for 2 to 3 months is commonly administered to patients with RSI >13 and/or RFS >7, and response to treatment confirms the diagnosis of LPRD [1,7-10]. More invasive but objective investigations, such as double-probe 24-hour pH monitoring and multi-channel impedance studies, are typically reserved for further evaluation of patients who do not respond to empirical PPI therapy [11]. Although a recent systematic review concluded that the evidence supporting PPI therapy for the treatment of LPRD is questionable [12], the current management protocol for patients suspected of having LPRD involves empirical PPI treatment for 2 to 4 months. Therapeutic lifestyle modifications (TLMs), such as avoiding certain foods or altering eating habits [13] and promoting alkaline water intake and/or a Mediterranean-style diet [14], have been suggested as additional treatment modalities to enhance the treatment response among patients with LPRD. Despite such efforts to improve treatment outcomes in these patients, the response rate to PPI and TLMs varies considerably. As a result, identifying potential predictors for response to PPI and TLMs in patients with LPRD is more important than ever before.
Several studies have assessed differences in baseline characteristics between responders and non-responders to 3 months of PPI medication [15-17]. Additionally, in a comparative study, researchers examined disparities in baseline characteristics between patients who responded after 1 month of treatment and those who responded after 3 months [18]. However, previous clinical trials have exclusively focused on the use of PPIs, and the treatment efficacy of various drugs has been evaluated without considering the impact of TLM on treatment outcomes. Moreover, factors commonly observed in clinical practice that may influence treatment outcomes, such as underlying comorbidities and medication history, have often been neglected. Furthermore, patient compliance with medication and/or lifestyle modifications has rarely been incorporated into prior analyses.
Common comorbid diseases in the general population, such as diabetes mellitus (DM) and hypertension, have been reported as significant risk factors for GERD and LPRD [19,20]. Although these risk factors for LPRD—part of the patient’s underlying medical history observed in actual clinical practice—may influence treatment outcomes, their predictive value has been overlooked and has never been evaluated. Furthermore, the potential impact of a patient’s underlying medication history on the treatment outcome of LPRD has not been assessed.
We hypothesized that treatment compliance, underlying comorbidities, and medication history collectively influence the treatment response among adult patients with LPRD. Therefore, the primary objective of this study was to conduct a comprehensive analysis of the predictive factors influencing the response to 1- and 3-month treatment courses with a PPI and TLM among these patients. The secondary objective was to identify potential predictive factors that differentiated early and late responders among those who responded to combination treatment for LPRD.
MATERIALS AND METHODS
This study adhered to the World Medical Association’s Declaration of Helsinki when conducting this study. It was approved by the Institutional Review Board of eight different institutions across Korea. Informed consent for participation was acquired from all participants.
A prospective, multicenter, open-label, post-authorized, cohort study was conducted at eight different institutions across a nation from October 2014 until June 2016. Patients with LPRD symptoms, aged 19 years or older, who agreed to participate in this study and completed written consent forms were enrolled. LPRD diagnosis was defined as patients with RSI ≥13 and RFS ≥7. Patients who were hospitalized, who were breast feeding, and those who had at least 1 of the contraindications to taking Esomezol (S-omeprazole strontium tetrahydrate 49.3 mg, Hanmi Medical) were excluded. In addition, the participants of this study were prohibited from taking additional PPIs during the study period. The detailed study information and contraindications to taking Esomezol are available in Supplementary Material 1, and the research participants informed consent form are available in Supplementary Material 2.
The participants were treated with combination of once-a-day Esomezol along with TLM for 3 months. The detailed instructions of the TLM are provided in Supplementary Material 1. The response to treatment was defined as more than 50% improvement of total RSI compared to pre-treatment baseline. Patients who responded to the treatment at 1 month were classified as early responders, and those who did not show a response at 1 month but showed a response at 3 months were classified as late responders.
The information on sex, age, change in body mass index (BMI), subjective severity of LPRD (Pre-RSI), objective severity of LPRD (Pre-RFS), past history of GERD, family history of LPRD, and number of concurrent medications taken during the study periods was collected as clinical characteristics. The pre-treatment hospital anxiety and depression scale-anxiety (HAD-A) and -depression (HAD-D) scale questionnaire was conducted to evaluate baseline psycho-emotional health, and information on compliance with medication and TLM was also gathered at each follow-up visit. Additionally, past and current medical history were collected and categorized into system organ class (SOC) and preferred term (PT) according to the Medical Dictionary (MedDRA, version 19.1), with some modifications. Past and current medication history were collected and categorized into anatomical code (AC) and therapeutic code (TC), according to the Anatomical Therapeutic Chemical Classification System (ATC, ver. 2017), with some modifications. All of these data were evaluated as potential predictors of the treatment response.
A recruitment of 400 patients was planned for this study. The detailed information on the estimation of the optimal sample size and its power calculation is described in Supplementary Material 3. For statistical analysis, Pearson’s chi-square test or Fisher’s exact test was performed to evaluate significant differences in non-continuous variables. The independent t-test was performed to compare the difference in continuous variables. Multivariate analysis for evaluation of predictors on treatment response was performed using logistic regression analysis by the forward conditional method. Independent variables that showed statistical significance in univariate analysis were included in this model along with age, sex, and medication compliance. All analyses were carried out using SAS software (ver. 9.4, SAS Institute Inc.). A two-tailed P-value of <0.05 was considered statistically significant.
RESULTS
Recruitment and participant flow
During the study period, a total of 394 patients were enrolled. However, 106 patients had dropped out by the 1-month followup, leaving 288 patients eligible for evaluation of the early treatment response. An additional 51 patients had dropped out by the 3-month follow-up, resulting in 237 patients eligible for evaluation of the overall treatment response and for comparative analysis between early and late responders (Fig. 1).
Detailed information on recruitment and participant flow. During the study period, 394 participants were enrolled. However, 106 participants had dropped out by the 1-month follow-up, and an additional 51 participants had dropped out by the 3-month follow-up. Therefore, data on 288 participants were utilized for predictor analysis of early response to treatment after 1 month, and data on 237 participants were utilized for predictor analysis of overall response to treatment after 3 months, as well as for predicting early responders compared to late responders. LPRD, laryngopharyngeal reflux disease.
Univariate analysis of early responders
Detailed results regarding the 1-month combination treatment response are summarized in Table 1, and Supplementary Tables 1-3 in Supplementary Material 4. Of the 288 patients, 124 (43.06%) were male and 164 (56.94%) were female, with a median age of 56 years (range, 19–88 years). A total of 109 patients demonstrated a response, constituting a 37.85% early response rate. Responders had a significantly lower frequency of history of GERD (responders vs. non-responders, 35 [32.11%] vs. 79 [44.13%], respectively; P=0.043), lower pre-RSI (responders vs. non-responders, mean±standard deviation of 15.84±4.02 vs. 16.81±4.12, respectively; P=0.012), and fewer concurrent medications (responders vs. non-responders, mean±standard deviation of 1.88±3.64 vs. 3.78±6.60, respectively; P=0.007). Furthermore, a significantly higher number of responders exhibited improved sleeping habits (responders vs. non-responders, 43 [39.45%] vs. 50 [27.93%], respectively; P=0.043), and fewer responders exhibited initial alcohol use (responders vs. nonresponders, 41 [37.61%] vs. 91 [50.84%], P=0.029).
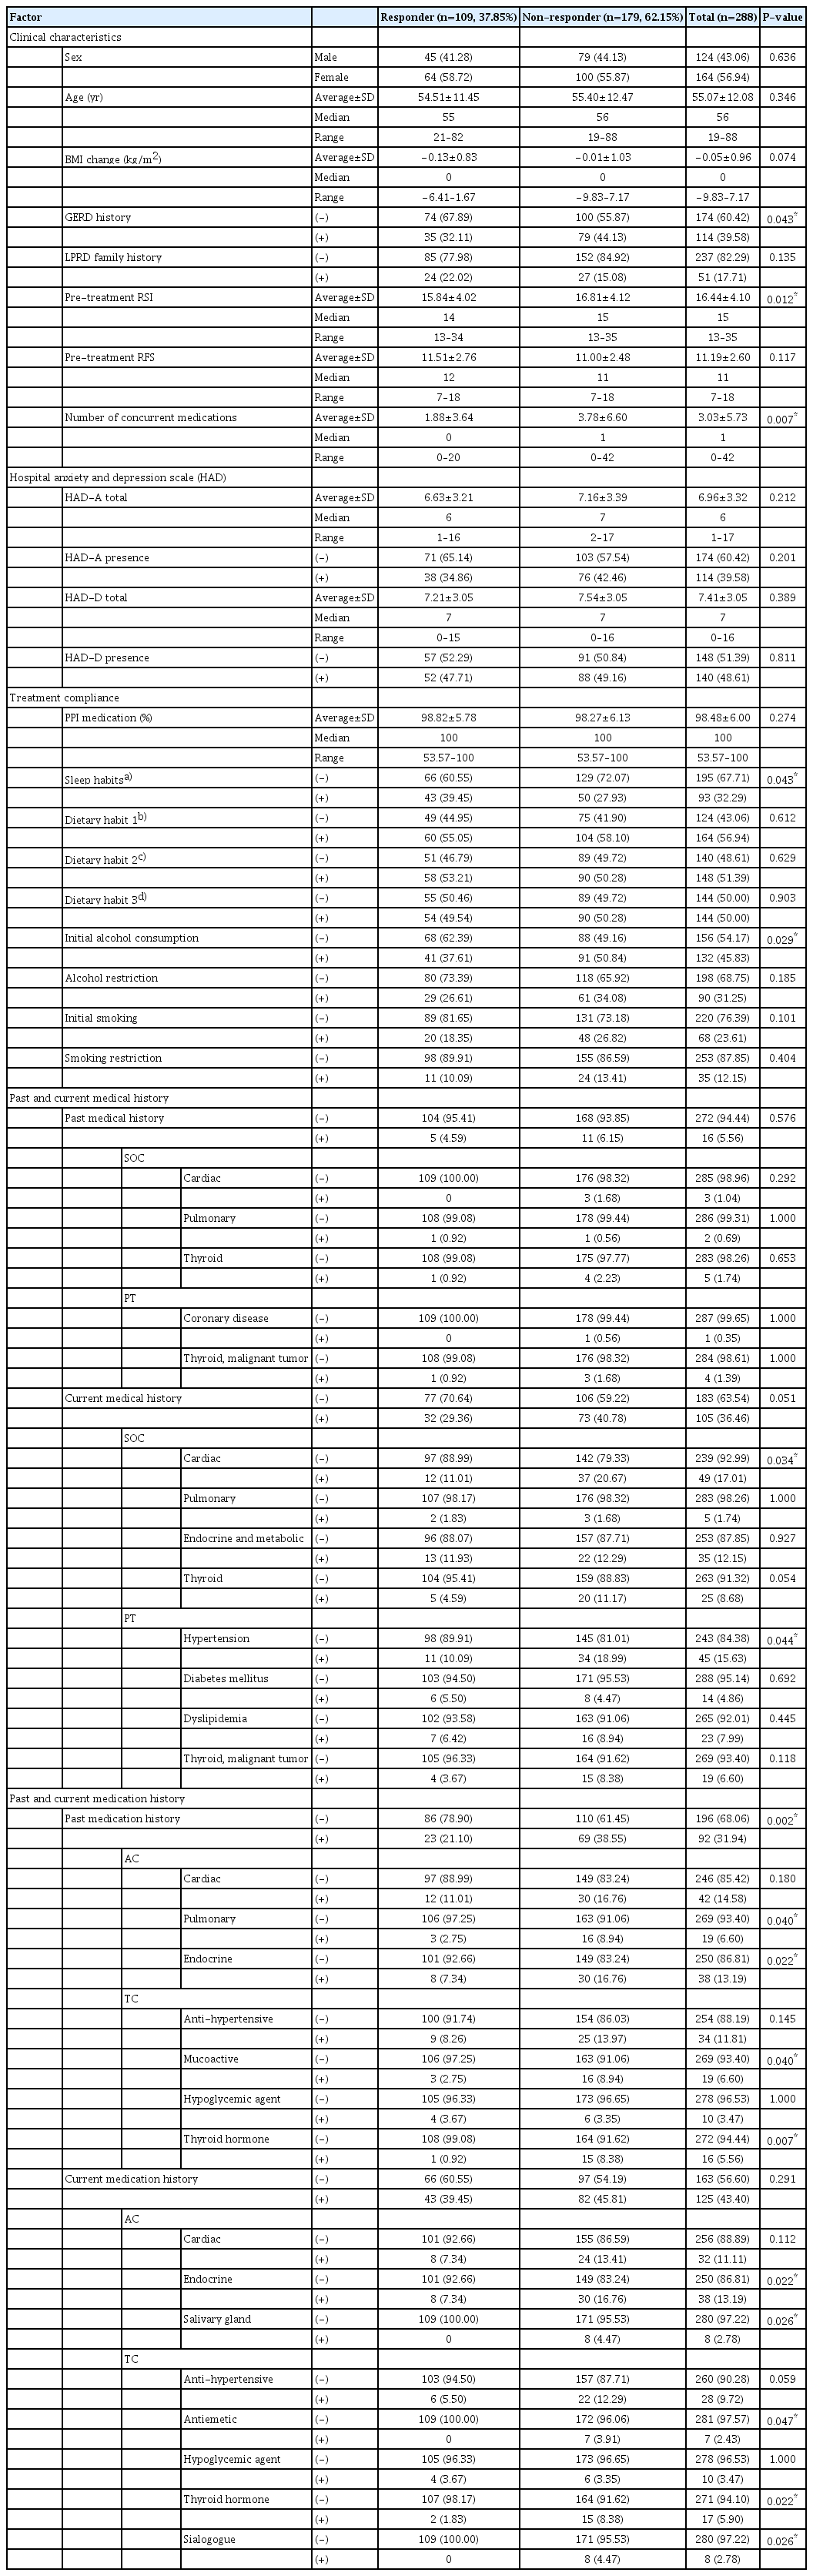
Univariate analysis of response to 1 month of treatment
In the analysis of past and current medical history, responders reported significantly fewer instances of cardiac disease (SOC; responders vs. non-responders, 12 [11.01%] vs. 37 [20.67%], respectively; P=0.034) and hypertension (PT; responders vs. non-responders, 11 [10.09%] vs. 34 [18.99%], respectively; P=0.044). Regarding past and current medication history, responders had a significantly lower prevalence of past medication use (responders vs. non-responders, 23 [21.10%] vs. 69 [38.55%], respectively; P=0.002), particularly in the areas of pulmonary (responders vs. non-responders, 3 [2.75%] vs. 16 [8.94%], respectively; P=0.040) and endocrine medications (responders vs. non-responders, 8 [7.34%] vs. 20 [16.76%], respectively; P=0.022) regarding AC, as well as mucoactive drugs (responders vs. non-responders, 3 [2.75%] vs. 16 [8.94%], respectively; P=0.040) and thyroid hormones (responders vs. non-responders, 1 [0.92%] vs. 15 [8.38%], respectively; P=0.007) regarding TC. For current medication use, fewer responders were taking endocrine (responders vs. non-responders, 8 [7.34%] vs. 30 [16.76%], respectively; P=0.022) and salivary gland medications (responders vs. non-responders, 0 [0.00%] vs. 8 [4.47%], respectively; P=0.026) for AC, as well as thyroid hormones (responders vs. non-responders, 2 [1.83%] vs. 15 [8.38%], respectively; P=0.022) and sialogogues (responders vs. non-responders, 0 [0.00%] vs. 8 [4.47%], respectively; P=0.026) for TC.
Univariate analysis of overall response
Detailed results regarding the overall response to 3 months of combination treatment are summarized in Table 2 and Supplementary Tables 4-6 in Supplementary Material 4. Of the 237 patients who completed the 3-month follow-up, 106 (44.73%) were male and 131 (55.27%) were female, with a median age of 56 years (range, 19 to 88 years). A total of 162 patients demonstrated a response, resulting in a 68.35% overall response rate. Responders exhibited significantly lower pre-RSI scores (responders vs. non-responders, mean±standard deviation of 16.27± 4.28 vs. 17.48±4.28, respectively; P=0.010) and higher preRFS scores (responders vs. non-responders, mean±standard deviation of 11.57±2.71 vs. 10.59±2.47, respectively; P=0.012). Anxiety was significantly less frequent among responders (responders vs. non-responders, 57 [35.19%] vs. 38 [50.67%], respectively; P=0.024), and both the total HAD-A score (responders vs. non-responders, mean±standard deviation of 6.64±3.25 vs. 7.68±3.48, respectively; P=0.021) and total HAD-D score (responders vs. non-responders, mean±standard deviation of 7.03±2.97 vs. 8.19±3.15, respectively; P=0.018) were significantly lower among responders.

Univariate analysis of response to 3 months of treatment
Regarding past and current medical history, significantly fewer responders had a current medical history (responders vs. non-responders, 51 [31.48%] vs. 35 [46.67%], respectively; P=0.024), particularly of thyroid disease (SOC; responders vs. non-responders, 7 [4.32%] vs. 14 [18.67%], respectively; P=0.0003) and malignant thyroid mass (PT; responders vs. non-responders, 4 [2.47%] vs. 12 [16.00%], respectively; P=0.0001). In terms of past and current medication history, significantly fewer responders had a past medication history of thyroid hormone (responders vs. non-responders, 3 [1.85%] vs. 10 [13.33%], respectively; P=0.001) in the TC category. Additionally, significantly fewer responders were taking endocrine medications (responders vs. non-responders, 17 [10.49%] vs. 15 [20.00%], respectively; P=0.046) in the AC category, as well as gastrointestinal tract mucosal cytoprotectants (responders vs. non-responders, 8 [4.94%] vs. 10 [13.33%], respectively; P=0.023), antiemetics (responders vs. non-responders, 1 [0.62%] vs. 6 [8.00%], respectively; P=0.005), or thyroid hormone (responders vs. non-responders, 5 [3.09%] vs. 10 [13.33%], respectively; P=0.007) in the TC category among current medications.
Univariate analysis of early versus late responders
Detailed results comparing early and late responders can be found in Table 3 and Supplementary Tables 7-9 in Supplementary Material 4. Of the 162 responders, 92 (56.79%) were classified as early responders, while 70 (43.21%) were considered late responders. The early responders demonstrated significantly lower pre-RSI scores (early responders vs. late responders, mean± standard deviation of 15.86±4.19 vs. 16.80±4.36, respectively; P=0.042) and fewer concurrent medications (early responders vs. late responders, mean±standard deviation of 1.92±3.87 vs. 3.59±6.95, respectively; P=0.033).

Univariate comparative analysis between early and late responders
Regarding past and current medical history, early responders in the PT category had a significantly lower frequency of current hypertension compared to late responders (9 [9.78%] vs. 15 [21.43%], respectively; P=0.039). Furthermore, a significantly smaller proportion of early responders had a history of past medication use (early responders vs. late responders, 18 [19.57%] vs. 25 [35.71%], respectively; P=0.021), and fewer early responders were currently taking antihypertensive medications in the TC category (early responders vs. late responders, 5 [5.43%] vs. 11 [15.71%], respectively; P=0.030).
Multivariate analysis of predictive factors
Detailed results of the multivariate analysis are summarized in Table 4. Compliance with sleep improvement recommendation was a positive predictive factor (odds ratio [OR], 1.785; 95% confidence interval [CI], 1.06–3.007; P=0.029), while initial alcohol status (OR, 0.587; 95% CI, 0.355–0.969; P=0.037) and the presence of a past medication history (OR, 0.438; 95% CI, 0.215–0.891; P=0.005) were negative predictive factors for early responders. Furthermore, male sex (OR, 0.516; 95% CI, 0.269– 0.987; P=0.046), HAD-D total score (OR, 0.867; 95% CI, 0.784– 0.958; P=0.005), and a past medication history of thyroid hormone in the TC category (OR, 0.161; 95% CI, 0.033–0.788; P=0.024) were negative predictive factors, while pre-RFS (OR, 1.187; 95% CI, 1.049–1.344; P=0.007) was a positive predictive factor for overall responders. The multivariate analysis comparing early and late responders revealed that only the presence of a past medication history (OR, 0.438; 95% CI, 0.215–0.891; P=0.023) was a negative predictive factor for early responders relative–late responders.
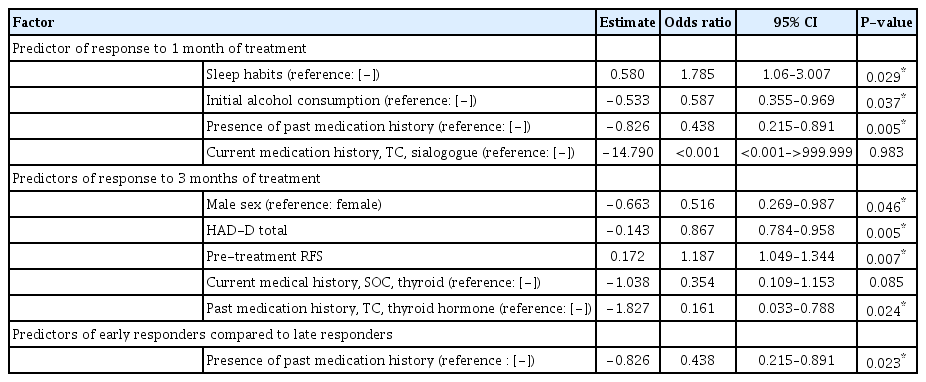
Results of multivariate analysis
DISCUSSION
The study results revealed that compliance with instructions for improved sleep habits, initial alcohol consumption, and history of past medication were significant predictors of early response to PPI and TLM treatment. Furthermore, sex, HAD-D total score, pre-RFS, and history of thyroid hormone medication were significant predictors for response to 3 months of treatment. Lastly, history of past medication was the sole negative predictor when comparing early and late responders.
The standard management algorithm for LPRD typically involves the use of PPI medication in conjunction with TLM [1,10]. However, PPI medication is often used alone due to poor compliance with TLM. While using PPIs alone may improve treatment adherence, recent studies have cast doubt on their efficacy in treating LPRD. According to a systematic review, six of nine systematic reviews/meta-analyses concluded that PPI therapy is not superior to a placebo [12]. Another systematic review and metaanalysis determined that PPIs only have a slight advantage over placebos [21]. Various TLM algorithm combinations have been proposed for LPRD [13,14]. In our study, we employed a combination treatment that included PPI medication along with modifications to dietary and sleeping habits, weight reduction as indicated by changes in BMI, and restrictions on alcohol consumption and smoking.
Few previous reports have attempted to identify potential predictors for response to PPI treatment among patients with LPRD. Pretreatment laryngoscope abnormalities and increased laryngopharyngeal bolus exposure time have been reported as significant positive predictors for response to 3 months of PPI treatment [16,22]. Age has been reported as a negative predictor for response to 3 months of PPI treatment [23], but the severity of pretreatment RSI and RFS scores have been found to have no predictive value [15]. Siupsinskiene et al. [18] concluded that baseline anxiety levels and heartburn scores, along with higher medication dosages, were potential predictors of 1-month PPI response, while no significant predictors were identified for response to 3 months of PPI treatment.
Our study involved a comprehensive analysis of the predictive value of compliance for each treatment, as well as the impact of clinical characteristics on treatment response. In the univariate analysis, factors such as history of GERD, pre-RSI, number of concurrent medications, initial alcohol status, and improved sleeping habits showed significance. Meanwhile, multivariate analysis identified compliance with sleep recommendations as a positive predictor and initial alcohol status as a negative predictor of early response to treatment. Pre-RSI and pre-RFS were significant predictive clinical characteristics; however, no treatment compliance factors were significant in the univariate analysis for response to 3-month treatment. The multivariate analysis revealed that male sex was a negative predictor=while pre-RFS was a positive predictor of response to 3 months of treatment.
Although a few previous reports have suggested a correlation between underlying psycho-emotional health and LPRD, our study results revealed that depression, but not anxiety, is a significant negative predictor of 3-month treatment response. Reportedly, GERD patients with LPRD symptoms experience significantly more depression than those without such symptoms, and the presence of LPRD is significantly associated with depression [24,25]. Furthermore, the mean HAD-A score has been identified as a relevant predictor of 1-month PPI treatment response [18]. In contrast to previous reports, neither anxiety nor depression affected the response to 1 month of treatment in the present study. However, the presence of anxiety and total anxiety and depression scores showed significant differences between responders and non-responders to 3 months of treatment. Additionally, the total depression score was a significant negative predictor in the multivariate analysis of response to 3 months of treatment. Nevertheless, psycho-emotional health did not exhibit a significant difference between early and late responders.
The primary novelty of our study, which strengthens its results, is that it is the first to present a comprehensive analysis evaluating the predictive value of past and current medical and medication history for response to different treatment durations. The deficiency of saliva in patients with Sjogren syndrome has been reported to increase susceptibility to the effects of regurgitation [26]. This finding suggests the importance of the neutralizing effect of bicarbonate in saliva, which may be crucial in the early phase of LPRD treatment. Similarly, the use of a sialogogue was associated with a significant difference in response to 1 month of treatment, but not in response to 3 months of treatment. Additionally, previous studies have suggested that thyroidectomy may exacerbate reflux disease [27,28]. In our research, patients with past or current thyroid disease did not exhibit significant differences in response to 1 month of treatment. However, patients with current thyroid disease, particularly malignant thyroid mass, exhibited a significant difference in response to 3 months of treatment. Furthermore, past and/or current use of thyroid hormone was associated with a significant difference in response to both 1- and 3-month treatment durations. Our results can be interpreted as indicating that patients with a medical history of malignant thyroid mass should undergo thyroidectomy. Additionally, patients with post-thyroidectomy hypothyroidism are predisposed to taking thyroid hormones, which is reflected as past and/or current use of thyroid hormone in our study. Consequently, although the multivariate analysis revealed no significant predictive value for response after 1 month, current medical history of thyroid disease and past medication history of thyroid hormone were significant negative predictors for response to 3 months of treatment.
In addition, our study is the first to compare predictive factors between early and late responders. Early responders demonstrated significantly lower pre-RSI scores, fewer concurrent medications, fewer patients with a current medical history of hypertension, and fewer patients taking anti-hypertensive medications relative to late responders. Hypertension and DM have been reported as significant risk factors for GERD and LPRD [19,20], with a notable association between type 2 DM and LPRD [29]. Although a current medical history of hypertension was significantly less common in responders after 1 month of treatment and in early responders compared to late responders, neither DM nor hypertension emerged as significant predictors in the multivariate analysis.
The findings of our study provide valuable insights into the standard management protocol for patients with LPRD. Based on our research, it is crucial for LPRD patients to understand that improving their sleep habits is a vital behavioral change necessary for successful treatment after 1 month. Furthermore, patients who consumed alcohol before treatment, had a history of taking any medications, or need to use a sialogogue alongside LPRD treatment should be informed that they may require 3 months of treatment to achieve a response. Additionally, LPRD patients with any past medication history can be advised that they are more likely to respond to combination treatment after 3 months than after 1 month. Conversely, male patients, those with a higher total depression score, lower pre-RFS, a current medical history of thyroid disease, or who have taken thyroid hormones should be cautioned that they are at significant risk of not responding to 3 months of treatment.
Nevertheless, this study has several limitations. First, 24-hour dual-probe pH monitoring and high-resolution manometry were not conducted. However, these test methods are not routinely performed because they are considered too invasive and cause substantial patient discomfort, and they are not always feasible in small medical facilities. We attempted to ensure the reliability of the LPRD diagnosis among our participants by combining RSI and RFS in the diagnostic criteria. Second, our analysis did not consider the presence of non-acid reflux and the effect of pepsin, which is considered a cause of PPI-resistant LPRD. As a result, non-responders in our study may have had mixed or biliary LPRD. Third, although this is a prospective, multicenter study, the dropout rate was higher than expected, leading to limited statistical power in our results. Given the limitations of our study, a well-designed prospective, multicenter, cohort study that is informed by a comprehensive analysis of our study, along with the results of ambulatory dual-probe pH monitoring with impedance, high-resolution manometry, and reliable pepsin test results as predictors of the response to currently known treatment algorithms, should be conducted in the near future. This will provide us with the knowledge needed to tailor personalized treatment algorithms and ultimately improve the treatment outcomes for adult patients with LPRD.
Improvement in sleep habits positively predicted response to 1-month combination treatment in LPRD patients, while initial alcohol consumption and history of past medication negatively predicted the response. Furthermore, a high pre-RFS score positively predicted the response to 3 months of treatment, whereas male sex, higher HAD-D score, and history of thyroid hormone medication negatively predicted it. Lastly, a history of past medication was the sole negative predictor distinguishing early responders from late responders. Future studies should investigate the precise role of these predictors in treatment response for patients with LPRD.
HIGHLIGHTS
▪ Improvement in sleep habits positively predicted the response to 1-month treatment, while initial alcohol consumption and past history of medication negatively predicted the treatment outcome.
▪ High pre-reflux finding score was a positive predictor of the response to 3-month treatment, whereas male sex, elevated hospital anxiety and depression scale-depression subscale, and a history of thyroid hormone medication use were negative predictors.
▪ The only negative predictor of early responders relative to late responders was the presence of past medication history.
▪ To standardize treatment, it is essential to determine the precise mechanisms of these predictors in relation to the treatment response for patients with laryngopharyngeal reflux disease in future studies.
Notes
This study was partially supported by a research grant from Hanmi Pharmaceutical Co. Ltd. (research ID: HM-IIT-ESO-004). This was an investigator-initiated study, and the funding company had no role in the design and conduct of the study; collection, management, analysis, and interpretation of the data; preparation, review, or approval of the manuscript; or decision to submit the manuscript for publication. No other potential conflicts of interest relevant to this article were reported.
AUTHOR CONTRIBUTIONS
Conceptualization: all authors. Methodology: SKK, EJJ, JHS, DIS, SMJ, BJL, ISP, JGC, YHP. Software: SKK, SJP, YHP. Validation: all authors. Investigation: SKK, EJJ, JHS, DIS, SMJ, BJL, ISP, JGC, YHP. Formal analysis: SKK, SJP, YHP. Data curation: SKK, SJP. Project administration: SKK, YHP. Funding acquisition: SKK, YHP. Writing–original draft: SKK, SJP, YHP. Writing–review & editing: all authors.
Acknowledgements
This study was partially supported by a research grant from Hanmi Pharmaceutical Co. Ltd. (research ID: HM-IIT-ESO-004).
The authors would like to thank biostatistician Jihye Yun (Symyoo Co. Ltd.) for her support with the statistical analysis in this study, as well as the contract research organization Symyoo Co. Ltd. (Seoul, Republic of Korea) for its support in the generation of electronic case report forms.
Institutional Review Board approval numbers are as follows: Seoul National University Hospital, Seoul National University: 1405-111-580; Kyungpook National University Chilgok Hospital, Kyungpook National University: 2014-04-167; Seoul St. Mary’s Hospital, The Catholic University of Korea: XC14OIMI0107K; Kangbuk Samsung Hospital, Sungkyunkwan University: 2014-11-016; Pusan National University Hospital, Pusan National University: 1411-014-037; Hallym University Dongtan Sacred Heart Hospital, Hallym University: 2014-307; Korea University Guro Hospital, Korea University: 2014GR0105; Yeouido St. Mary’s Hospital, The Catholic University of Korea: XC14OIMI0107S.
Supplementary materials
Supplementary materials can be found online at https://doi.org/10.21053/ceo.2023.00409.
Study Information.
Research Participants Informed Consent Form.
Statistical methods for determination of sample size and power calculations.
Supplementary Tables 1-9.